Good Morning Traders,

As of this writing 3:45 AM EST, here’s what we see:

US Dollar: Sept. USD is Down at 94.120.
Energies:
Aug '18 Crude is Down at 73.96.
Financials:
The Sept 30 year bond is Down 7 ticks and trading at 145.04.
Indices:
The Sept S&P 500 emini ES contract is 42 ticks Lower and trading at 2723.75.
Gold:
The Aug gold contract is trading Up at 1255.20. Gold is 17 ticks Higher than its close.

Initial Conclusion

This is not a correlated market. The dollar is Down- and Crude is Down- which is not normal and the 30 year Bond is trading Lower. The Financials should always correlate with the US dollar such that if the dollar is lower then bonds should follow and vice-versa. The S&P is Higher and Crude is trading Lower which is correlated. Gold is trading Up+ which is correlated with the US dollar trading Down-. I tend to believe that Gold has an inverse relationship with the US Dollar as when the US Dollar is down, Gold tends to rise in value and vice-versa. Think of it as a seesaw, when one is up the other should be down. I point this out to you to make you aware that when we don't have a correlated market, it means something is wrong. As traders you need to be aware of this and proceed with your eyes wide open.

At this hour all of Asia is trading Lower with the exception of the Singapore exchange which is only fractionally Higher. Currently all of Europe is trading Higher.

Possible Challenges To Traders Today

  • Challenger Job Cuts is out at 7:30 AM EST. This is major.

  • ADP Non-Farm Employment Change is out at 8:15 AM. This is major.

  • Unemployment Claims is out at 8:30 AM EST. This is major.

  • Final Services PMI is out at 9:45 AM EST. This is major.

  • ISM Non-Manufacturing PMI is out at 10 AM EST. Major.

  • Crude Oil Inventories is out at 11 AM EST. This is major.

  • FOMC Meeting Minutes is out at 2 PM EST. This is major.
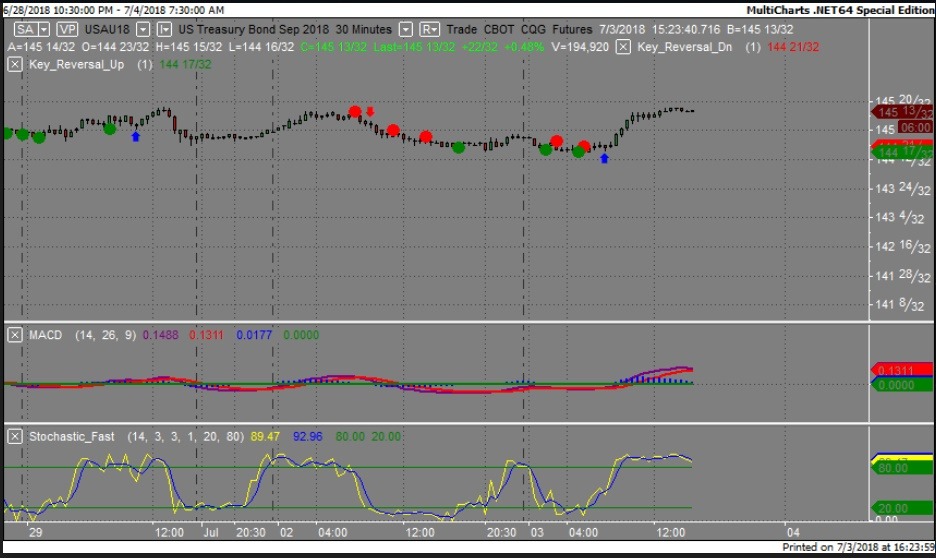
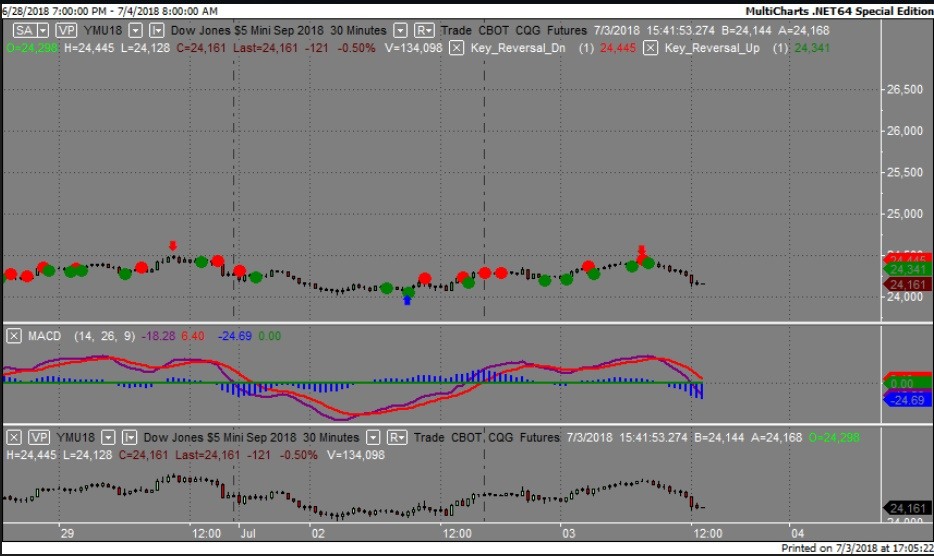
 Treasuries

We've elected to switch gears a bit and show correlation between the 30 year bond (ZB) and The YM futures contract. The YM contract is the DJIA and the purpose is to show reverse correlation between the two instruments. Remember it's liken to a seesaw, when up goes up the other should go down and vice versa.

Yesterday the ZB made it's move at around 8 AM EST. The ZB hit a Low at around that time and the YM hit a High. If you look at the charts below ZB gave a signal at around 8 AM EST and the YM was moving Lower at the same time. Look at the charts below and you'll see a pattern for both assets. ZB hit a Low at around 8 AM and the YM was moving Lower at the same time. These charts represent the newest version of MultiCharts and I've changed the timeframe to a 30 minute chart to display better. This represented a long opportunity on the 30 year bond, as a trader you could have netted about 20 plus ticks per contract on this trade. Each tick is worth $31.25.

Charts Courtesy of MultiCharts built on an AMP platform.

Tea

Tea

Bias

On Tuesday we gave the markets an Upside bias as the USD and the Bonds were both trading Lower Tuesday morning and this usually bodes well for an Upside day. The markets however had other ideas as the Dow dropped 132 points and the other indices lost ground as well. Today we aren't dealing with a correlated market with our bias to the Upside.

Could this change? Of Course. Remember anything can happen in a volatile market.

Commentary

It would as though the US is not quite out of the woods when it comes to the Trade War issue. Canada and the EU has already determined that they will increase tariffs on imported goods from the United States. No matter which way you look this isn't good for the US economy as America will play tit for tat game with the rest of the industrial world. Today we have about 7 major economic reports, all of which are major and proven market movers.

Trading performance displayed herein is hypothetical. The following Commodity Futures Trading Commission (CFTC) disclaimer should be noted.

Hypothetical performance results have many inherent limitations, some of which are described below. No representation is being made that any account will or is likely to achieve profits or losses similar to those shown.

In fact, there are frequently sharp differences between hypothetical performance results and the actual results subsequently achieved by any particular trading program. One of the limitations of hypothetical performance trading results is that they are generally prepared with the benefit of hindsight.

In addition, hypothetical trading does not involve financial risk, and no hypothetical trading record can completely account for the impact of financial risk in actual trading. For example, the ability to withstand losses or to adhere to a particular trading program in spite of trading losses are material points which can also adversely affect actual trading results.

There are numerous other factors related to the markets in general or to the implementation of any specific trading program which cannot be fully accounted for in the preparation of hypothetical performance results and all of which can adversely affect actual trading results.

Trading in the commodities markets involves substantial risk and YOU CAN LOSE A LOT OF MONEY, and thus is not appropriate for everyone. You should carefully consider your financial condition before trading in these markets, and only risk capital should be used.

In addition, these markets are often liquid, making it difficult to execute orders at desired prices. Also, during periods of extreme volatility, trading in these markets may be halted due to so-called “circuit breakers” put in place by the CME to alleviate such volatility. In the event of a trading halt, it may be difficult or impossible to exit a losing position.

Recommended Content


Recommended Content

Editors’ Picks

EUR/USD fluctuates near 1.0700 after US data

EUR/USD fluctuates near 1.0700 after US data

EUR/USD stays in a consolidation phase at around 1.0700 in the American session on Wednesday. The data from the US showed a strong increase in Durable Goods Orders, supporting the USD and making it difficult for the pair to gain traction.

EUR/USD News

USD/JPY refreshes 34-year high, attacks 155.00 as intervention risks loom

USD/JPY refreshes 34-year high, attacks 155.00 as intervention risks loom

USD/JPY is renewing a multi-decade high, closing in on 155.00. Traders turn cautious on heightened risks of Japan's FX intervention. Broad US Dollar rebound aids the upside in the major. US Durable Goods data are next on tap. 

USD/JPY News

Gold stays in consolidation above $2,300

Gold stays in consolidation above $2,300

Gold finds it difficult to stage a rebound midweek following Monday's sharp decline but manages to hold above $2,300. The benchmark 10-year US Treasury bond yield stays in the green above 4.6% after US data, not allowing the pair to turn north.

Gold News

Worldcoin looks set for comeback despite Nvidia’s 22% crash Premium

Worldcoin looks set for comeback despite Nvidia’s 22% crash

Worldcoin price is in a better position than last week's and shows signs of a potential comeback. This development occurs amid the sharp decline in the valuation of the popular GPU manufacturer Nvidia.

Read more

Three fundamentals for the week: US GDP, BoJ and the Fed's favorite inflation gauge stand out Premium

Three fundamentals for the week: US GDP, BoJ and the Fed's favorite inflation gauge stand out

While it is hard to predict when geopolitical news erupts, the level of tension is lower – allowing for key data to have its say. This week's US figures are set to shape the Federal Reserve's decision next week – and the Bank of Japan may struggle to halt the Yen's deterioration. 

Read more

Majors

Cryptocurrencies

Signatures