Trade Talks On?
US Dollar: Dec USD is Down at 98.315.
Energies: Nov '19 Crude is Up at 54.44.
Financials: The Dec 30 year bond is Down 6 ticks and trading at 162.02.
Indices: The Dec S&P 500 emini ES contract is 108 ticks Higher and trading at 2968.00.
Gold: The Dec Gold contract is trading Up at 1503.08. Gold is 29 ticks Higher than its close.
Initial Conclusion
This is not a correlated market. The dollar is Down- and Crude is Up+ which is normal and the 30 year Bond is trading Lower. The Financials should always correlate with the US dollar such that if the dollar is lower then bonds should follow and vice-versa. The S&P is Higher and Crude is trading Higher which is not correlated. Gold is trading Higher which is correlated with the US dollar trading Down. I tend to believe that Gold has an inverse relationship with the US Dollar as when the US Dollar is down, Gold tends to rise in value and vice-versa. Think of it as a seesaw, when one is up the other should be down. I point this out to you to make you aware that when we don't have a correlated market, it means something is wrong. As traders you need to be aware of this and proceed with your eyes wide open.
At this time all of Asia is trading Higher. Currently all of Europe is trading mainly Higher with the exception of the London exchange which is fractionally Lower.
Possible Challenges To Traders Today
-
Import Prices m/m is out at 8:30 AM EST. This is major.
-
Prelim UoM Consumer Sentiment is out at 10 AM EST. This is major.
-
Prelim UoM Inflation Expectations are out at 10 AM EST. This is major.
-
FOMC Member Rosengren Speaks at 1:15 PM EST. This is major.
Treasuries
We've elected to switch gears a bit and show correlation between the 30 year bond (ZB) and The S&P futures contract. The S&P contract is the Standard and Poor's and the purpose is to show reverse correlation between the two instruments. Remember it's liken to a seesaw, when up goes up the other should go down and vice versa.
Yesterday the ZB made a major move at around 8:15 AM EST. The ZB hit a High at around that time and the S&P hit a Low. If you look at the charts below ZB gave a signal at around 8:15 AM EST and the S&P was moving Higher at the same time. Look at the charts below and you'll see a pattern for both assets. ZB hit a High at around 8:15 AM and the S&P was moving Higher at the same time. These charts represent the newest version of MultiCharts and I've changed the timeframe to a 15 minute chart to display better. This represented a Shorting opportunity on the 30 year bond, as a trader you could have netted about 20 ticks per contract on this trade. Each tick is worth $31.25. Please note: the front month for the ZB is now December. The S&P contract is now at December as well and I've changed the format to Renko bars such that it may be more apparent and visible.
Charts Courtesy of MultiCharts built on an AMP platform
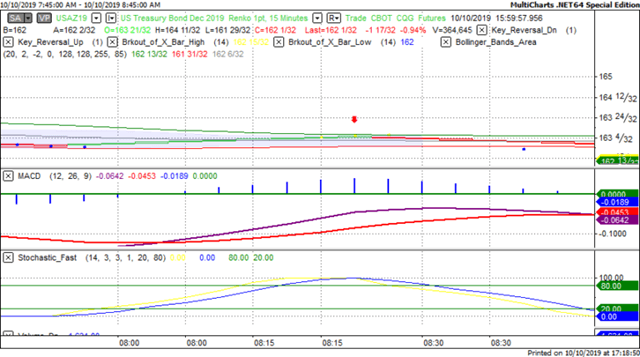
ZB - December, 2019 - 10/10/19
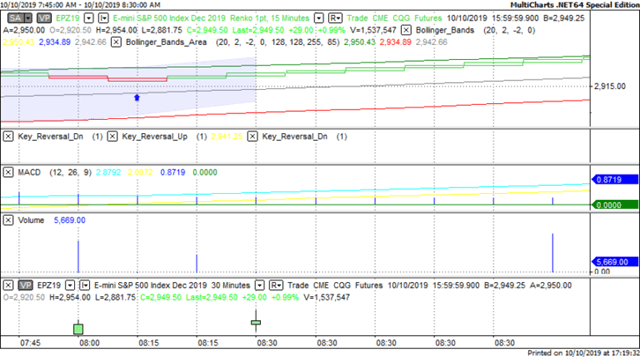
SP December 2019- 10/10/19
Bias
Yesterday we gave the markets a Neutral bias as we didn't see any signs of correlation with the futures. The Dow closed Higher by 151 points and the other indices closed Higher as well. Today we aren't dealing with a correlated market however our bias is to the Upside.
Could this change? Of Course. Remember anything can happen in a volatile market.
Commentary
So yesterday we gave the markets a Neutral bias which means it could go in any direction but closed Higher. Why? The long awaited trade meeting between the US and China will be held today and the markets were hopefully of a result regarding this. Time will tell if we get that result and/or resolution on this issue. In the meantime the CPI data reported yesterday doesn't show any signs of inflation or the forewarning of an inflationary period ahead. So the Federal should be content with that as it means they won't have to raise rates and in fact may cut further. Time will tell on this as well.....
Author

Nick Mastrandrea
Market Tea Leaves


