Tracking US treasury yields, dollar extends losses

Charts provided by Trading View
EUR/USD:
Monthly timeframe:
(Technical change on this timeframe is often limited, though serves as guidance to potential longer-term moves)
March carved out a third consecutive loss, extending the 2021 retracement slide by 2.8 percent. Recent underperformance, as you can see, pulled EUR/USD into the upper range of demand at 1.1857/1.1352.
April’s 1.5 percent rebound thus far, however, shifts attention to the possibility of fresh 2021 peaks and a test of ascending resistance (prior support – 1.1641).
Extending lower, on the other hand, shines the technical spotlight on trendline resistance-turned support, taken from the high 1.6038.
In terms of trend, the primary uptrend has been underway since price broke the 1.1714 high (Aug 2015) in July 2017.
Daily timeframe:
Safe-haven USD demand took a back seat Thursday, elevating EUR/USD above the 200-day simple moving average at 1.1882 (typically interpreted as a bullish signal) and bringing light to resistance stationed at 1.1966, followed by another layer of resistance at 1.2058.
As for trend on the daily scale, we’ve been higher since early 2020.
From the RSI oscillator, the value swept through trendline resistance, drawn from the peak 76.00, and recently took on the 50.00 centreline. This also underlines resistance at 60.30.
H4 timeframe:
1.1870 support served buyers well in recent movement, with the pair now circling territory just south of Quasimodo resistance at 1.1937.
Space north of 1.1937 shines the technical spotlight on resistance plotted at 1.1990.
H1 timeframe:
Supply at 1.1956/1.1935 is now within touching distance on the H1 scale, and given the zone houses H4 Quasimodo resistance at 1.1937 we may see sellers welcome the base today.
In terms of supportive structure, the chart highlights 1.1898 (previous Quasimodo resistance), followed by demand at 1.1851/1.1861 (sited just beneath H4 support at 1.1870) and 1.1836/1.1846.
The relative strength index (RSI) shows its value exited overbought space in recent trading and established early bearish divergence.
Observed levels:
H4 Quasimodo resistance at 1.1937, alongside H1 supply at 1.1956/1.1935 and the RSI overbought signal, underscores confluence to be mindful of.
Longer term, on the other hand, shows daily price made its way above the 200-day simple moving average with room to advance towards 1.1966 resistance (above H1 supply at 1.1956/1.1935). Note the cross above the 200-day SMA is supported by monthly price displaying bullish life out of demand at 1.1857/1.1352.

AUD/USD:
Monthly timeframe:
(Technical change on this timeframe is often limited, though serves as guidance to potential longer-term moves)
February finished considerably off best levels, establishing what many candlestick fans call a shooting star pattern—a bearish signal found at peaks. What’s interesting was February also came within striking distance of trendline resistance (prior support - 0.4776), sheltered under supply from 0.8303/0.8082.
March erased 1.5% over the Month and probed February’s lows. Should subsequent Months see sellers take the reins, demand is in view at 0.7029/0.6664 (prior supply).
With respect to trend (despite the trendline resistance [1.0582] breach in July 2020), the primary downtrend (since mid-2011) remains in play until breaking 0.8135 (January high [2018]).
Daily timeframe:
Largely unchanged analysis from previous report.
Since 25th March, buyers and sellers have been squaring off around the 0.7563 February low.
Resistance on the daily timeframe remains at 0.7817; a dip beneath 0.7563 brings light to demand from 0.7453/0.7384 (dovetailing closely with a 100% Fib extension at 0.7465 and a 1.618% Fib projection at 0.7389). Technicians will also note the 200-day simple moving average circling nearby at 0.7398.
Trend studies reveal the unit has been higher since early 2020.
As for the RSI oscillator, the value is reinforced off channel support, taken from the low 43.70, and is currently nearing the underside of 50.00.
H4 timeframe:
Despite sellers making an entrance from resistance at 0.7668, the lack of follow-through interest beyond last Friday’s low around 0.7592 rotates the technical radar to higher levels.
Supply is parked nearby at 0.7696/0.7715, accompanied by trendline resistance, from the high 0.8007, and a 50.0% retracement value at 0.7689.
H1 timeframe:
An early break/retest scenario above the 100-period simple moving average at 0.7634 was clearly welcomed by longs on Thursday, consequently elbowing the 1.272% Fib projection into the spotlight at 0.7664 (planted just under H4 resistance at 0.7668).
Area above 0.7664 exhibits scope to approach as far north as the 0.77 figure and supply tucked just above at 0.7716/0.7707.
RSI flow is currently on the doorstep of overbought space, following Wednesday’s near-test of trendline resistance-turned support, extended from the high 69.00. Of particular interest within overbought territory is resistance at 80.85.
Observed levels:
From the bigger picture, the lack of buying interest from the 0.7563 February low on the daily scale may be due to monthly price pencilling in a bearish candlestick formation in February ahead of notable structure.
In conjunction with the monthly chart, H1 price echoes resistance in the form of a 1.272% Fib projection at 0.7664, aided by H4 resistance at 0.7668.

USD/JPY:
Monthly timeframe:
(Technical change on this timeframe is often limited, though serves as guidance to potential longer-term moves)
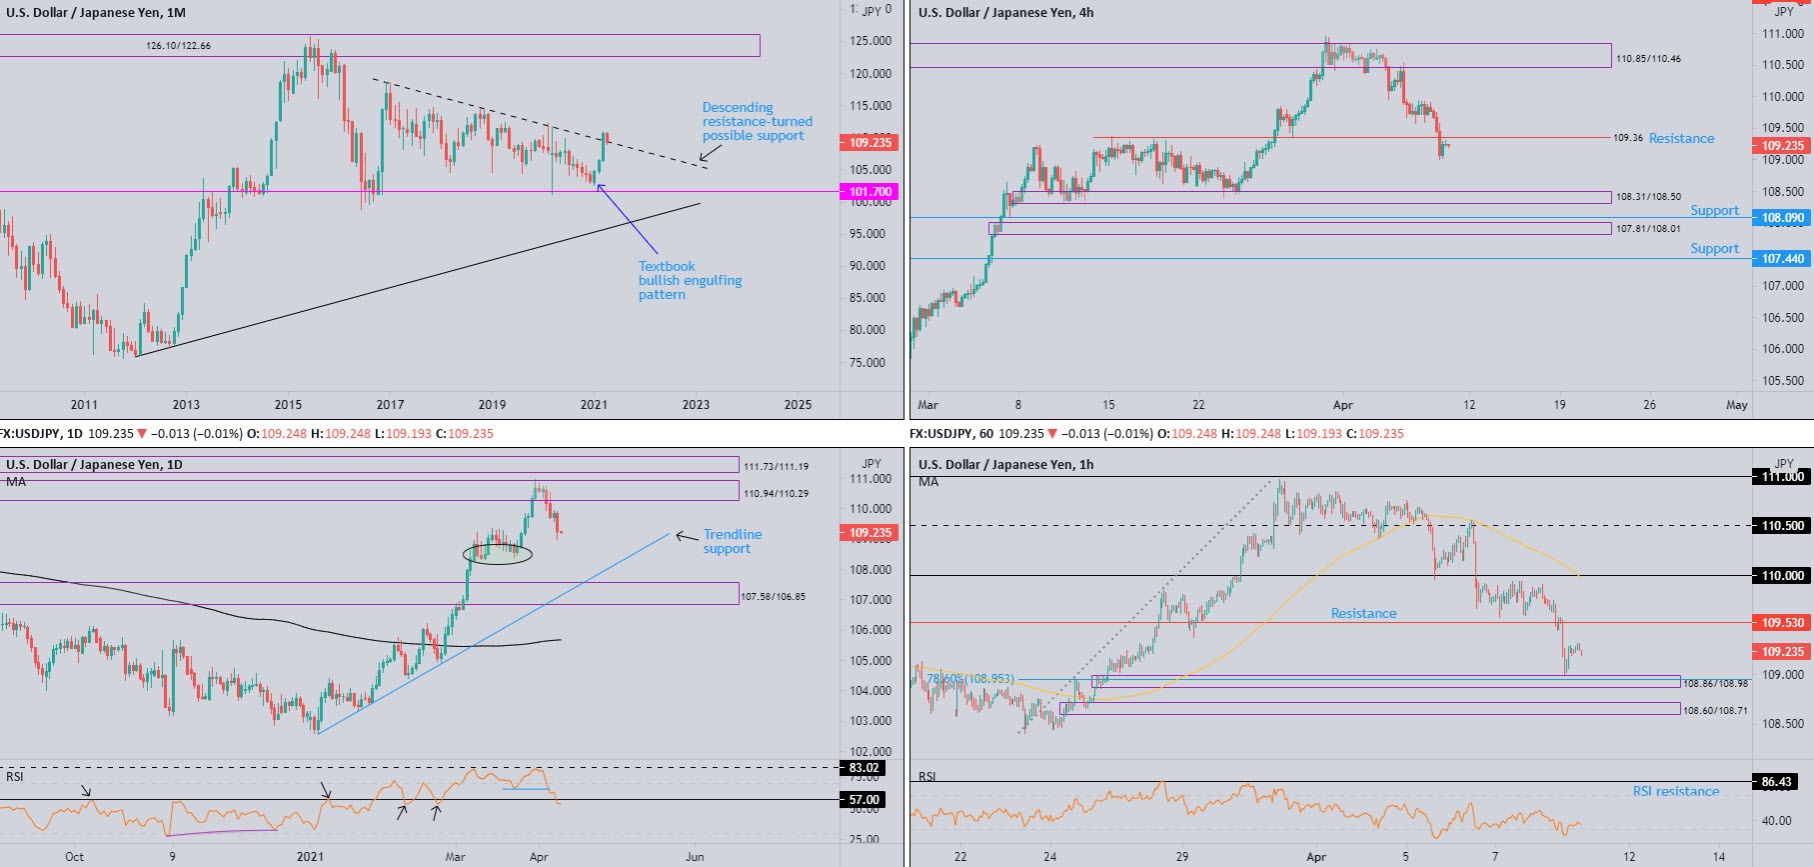
Following January’s bullish engulfing candle and February’s outperformance, March concluded up by 3.9 percent and marginally cut through descending resistance, etched from the high 118.66.
April, as you can see, is retesting the breached descending resistance, movement that may entice bullish flow. In terms of long-term upside targets, supply at 126.10/122.66 calls for attention.
Daily timeframe:
Sliding US Treasury yields—benchmark 10-year yield fell 3 percent—along with the US dollar index cementing itself under the 200-day simple moving average, pressured USD/JPY to session troughs at 109ish on Thursday.
Aside from a collection of lows around 108.36ish (green oval), limited support is offered on the daily scale until connecting with demand coming in at 107.58/106.85 and joining trendline support, etched from the low 102.59.
In terms of trend on the daily scale, we have been decisively higher since early 2021.
RSI action journeyed through support at 57.00, suggesting momentum to the downside could gather traction.
H4 timeframe:
Thursday’s one-sided decline nudged H4 action through support at 109.36 (now a potentially serving resistance), and unbolted the trap door for further selling towards demand printed at 108.31/108.50 (an area holding lows highlighted on the daily scale around 108.36).
H1 timeframe:
Thursday moved price action to within touching distance of demand at 108.86/108.98, an area holding a 78.6% Fib level at 108.95 within its walls.
To the upside, resistance is visible at 109.53, a previous Quasimodo support level, while sellers taking over current demand throws light on demand from 108.60/108.71.
The RSI oscillator exited oversold territory Thursday, movement usually viewed as a bullish signal.
Observed levels:
With the monthly timeframe testing descending resistance-turned possible support, continuation selling may be short-lived.
The above indicates H1 could hold demand at 108.86/108.98 and approach H1 resistance from 109.53. This, of course, suggests H4 resistance is unlikely to offer much of a ceiling.
GBP/USD:
Monthly timeframe:
(Technical change on this timeframe is often limited, though serves as guidance to potential longer-term moves)
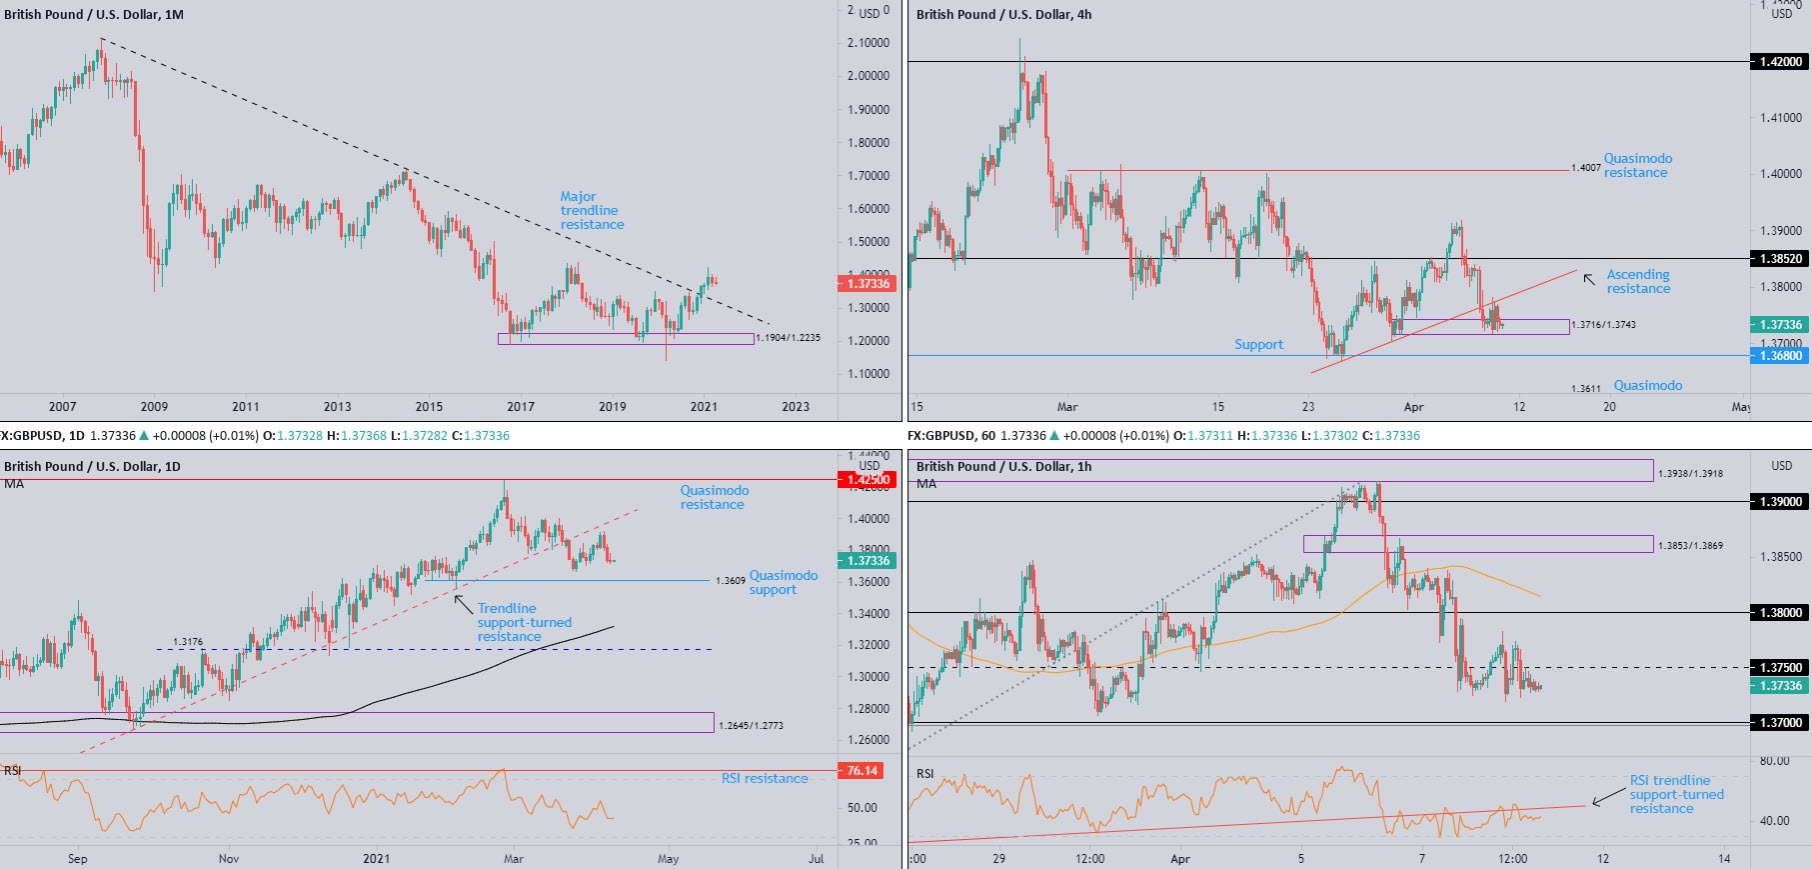
The pendulum swung in favour of buyers following December’s 2.5 percent advance, stirring major trendline resistance (2.1161). February followed through to the upside (1.7 percent) and refreshed 2021 highs at 1.4241, levels not seen since 2018. Contained within February’s range, however, March snapped a five-month winning streak and formed what candlestick enthusiasts call an inside candle pattern—represents a short-term consolidation with low volatility. A breakout lower tends to be considered a bearish signal.
Despite the trendline breach, primary trend structure has faced lower since early 2008, unbroken (as of current price) until 1.4376 gives way (April high 2018).
Daily timeframe:
Largely unchanged analysis from previous report.
Sterling concluded Thursday off best levels, despite dollar weakness.
Technically, as aired in recent analysis, GBP/USD put in a top just south of trendline support-turned resistance, extended from the low 1.1409, at the beginning of the week. Additional weakness could eventually see the unit test the mettle of Quasimodo support at 1.3609.
With reference to trend, GBP/USD has been trending higher since early 2020.
The RSI has failed to find acceptance north of the 50.00 centreline so far this week, informing traders momentum remains to the downside.
H4 timeframe:
Demand coming in from 1.3716/1.3743 and ascending resistance (taken from the low 1.3670), as you can see, welcomed consolidation on Thursday.
External areas to be mindful of are support at 1.3680, followed by Quasimodo support at 1.3611, and resistance parked at 1.3852.
H1 timeframe:
Yesterday’s ranging action on the H1 witnessed price action fluctuate around 1.3750.
With reference to technical structure, 1.37/38 offer support and resistance levels to be aware of, with 1.38 also dovetailing closely with the 100-period simple moving average at 1.3815, and 1.37 joining a deep 88.6% Fib level at 1.3697.
With the RSI showing upside contained by trendline support-turned resistance, drawn from the low 23.30, price may explore territory south of 1.3750 today to target 1.37.
Observed levels:
Lacklustre bullish interest out of H4 demand at 1.3716/1.3743 (aided by ascending resistance), together with an absence of obvious support on the daily chart, may have H1 sellers push south of 1.3750 to 1.37 and maybe H4 support at 1.3680.
Premium
You have reached your limit of 3 free articles for this month.
Start your subscription and get access to all our original articles.
Author

Aaron Hill
FP Markets
After completing his Bachelor’s degree in English and Creative Writing in the UK, and subsequently spending a handful of years teaching English as a foreign language teacher around Asia, Aaron was introduced to financial trading,


