Oil has hard a remarkable rally from the March 2020 low, and further upside is favoured to take place in the energy sector still. There is one energy producer that has vastly outperformed many other producers, Torchlight Energy Resources. From an all time low of 21 cents set in September 2020, to the recent peak of 4.83, this stock represents high volatility price action. Lets take a look at the company profile and see what they do:
“Torchlight Energy Resources, Inc. (NASDAQ: TRCH), based in Plano, Texas, is a high growth oil and gas Exploration and Production (E&P) company with a primary focus on acquisition and development of highly profitable domestic oil fields. The company currently holds interests in Texas where their targets are established plays such as the Permian Basin and the Eagle Ford Shale.”
lets dig into the charts!
Torchlight Energy Resources Elliott wave View:
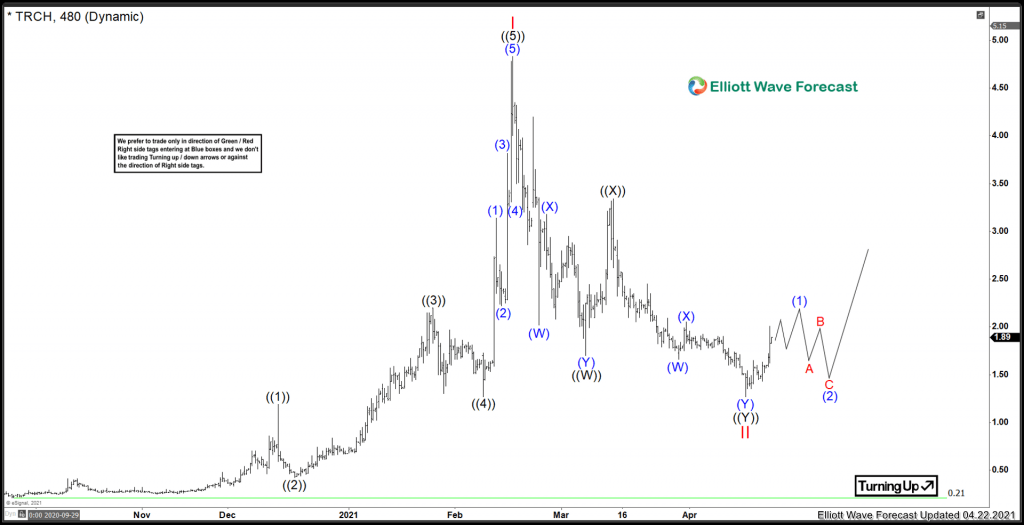
extraordinary. The rally from the 0.21 September low to the 4.83 February peak represents a 2300% return within a few short months. It can be expected that a long and deep correction can be expected from such a rally. There is a clear 5 waves structure heading into the Feb peak. Coming out of an all time low in September 2020, this peak can be counted as the first wave of a long extended rally. From the Red I peak, prices sharply fell in a double correction ((W)) wave. After that, a connector in ((X)). After that, another swing lower to form a low in Red II.
The RSI momentum at the Red II low has a very extreme reading. Should the stock continue to fall lower than 1.27, it would likely diverge in momentum. This would would point to a more prolonged correction in time and price. For now, the bottom is favoured to be set as long as $1.27 level holds. Presently, the expectation is for a rally into blue (1) before pulling back in (2), and then further extension higher.
FURTHER DISCLOSURES AND DISCLAIMER CONCERNING RISK, RESPONSIBILITY AND LIABILITY Trading in the Foreign Exchange market is a challenging opportunity where above average returns are available for educated and experienced investors who are willing to take above average risk. However, before deciding to participate in Foreign Exchange (FX) trading, you should carefully consider your investment objectives, level of xperience and risk appetite. Do not invest or trade capital you cannot afford to lose. EME PROCESSING AND CONSULTING, LLC, THEIR REPRESENTATIVES, AND ANYONE WORKING FOR OR WITHIN WWW.ELLIOTTWAVE- FORECAST.COM is not responsible for any loss from any form of distributed advice, signal, analysis, or content. Again, we fully DISCLOSE to the Subscriber base that the Service as a whole, the individual Parties, Representatives, or owners shall not be liable to any and all Subscribers for any losses or damages as a result of any action taken by the Subscriber from any trade idea or signal posted on the website(s) distributed through any form of social-media, email, the website, and/or any other electronic, written, verbal, or future form of communication . All analysis, trading signals, trading recommendations, all charts, communicated interpretations of the wave counts, and all content from any media form produced by www.Elliottwave-forecast.com and/or the Representatives are solely the opinions and best efforts of the respective author(s). In general Forex instruments are highly leveraged, and traders can lose some or all of their initial margin funds. All content provided by www.Elliottwave-forecast.com is expressed in good faith and is intended to help Subscribers succeed in the marketplace, but it is never guaranteed. There is no “holy grail” to trading or forecasting the market and we are wrong sometimes like everyone else. Please understand and accept the risk involved when making any trading and/or investment decision. UNDERSTAND that all the content we provide is protected through copyright of EME PROCESSING AND CONSULTING, LLC. It is illegal to disseminate in any form of communication any part or all of our proprietary information without specific authorization. UNDERSTAND that you also agree to not allow persons that are not PAID SUBSCRIBERS to view any of the content not released publicly. IF YOU ARE FOUND TO BE IN VIOLATION OF THESE RESTRICTIONS you or your firm (as the Subscriber) will be charged fully with no discount for one year subscription to our Premium Plus Plan at $1,799.88 for EACH person or firm who received any of our content illegally through the respected intermediary’s (Subscriber in violation of terms) channel(s) of communication.
Recommended Content
Editors’ Picks
AUD/USD remains under pressure above 0.6400
AUD/USD managed to regain some composure and rebounded markedly from Tuesday’s YTD lows in the sub-0.6400 region ahead of the release of the Australian labour market report on Thursday.
EUR/USD faces decent contention around 1.0600
The knee-jerk in the Greenback reignited some buying interest in the risk complex and pushed EUR/USD to three-day highs near 1.0680, rapidly leaving behind the recent yearly low around 1.0600.
Gold eases despite risk-off mood
Gold trades in a relatively tight range near $2,390 in the second half of the day on Wednesday. In the absence of high-tier data releases, investors keep a close eye on headlines surrounding the Iran-Israel conflict.
Ethereum trades around the $3,000 support following a surge in validator queue
Ethereum (ETH) continued a sideways movement on Wednesday as investors seemed to be waiting for an upward or downward price catalyst. Despite the price stagnancy, the ETH validator queue - possibly fueled by the DeFi restaking boom - rose sharply.
Markets stabilize after Powell rules out rate hike, but the signs don’t look good
Markets are volatile right now; however, a relative calm has descended on the market and US. US stocks are down a touch, but the Vix is lower, US Treasury yields are lower, and the dollar is mostly lower vs. its G10 FX counterparts.