Topping Pattern or Just Pause Before Going Higher?

It was all about the FOMC Rate Decision release on Wednesday, and stocks' initial reaction to that news was slightly negative. The broad stock market extended its short-term consolidation along the resistance level. Will the uptrend continue or is this some topping pattern ahead of downward reversal? There are still two possible medium-term scenarios.
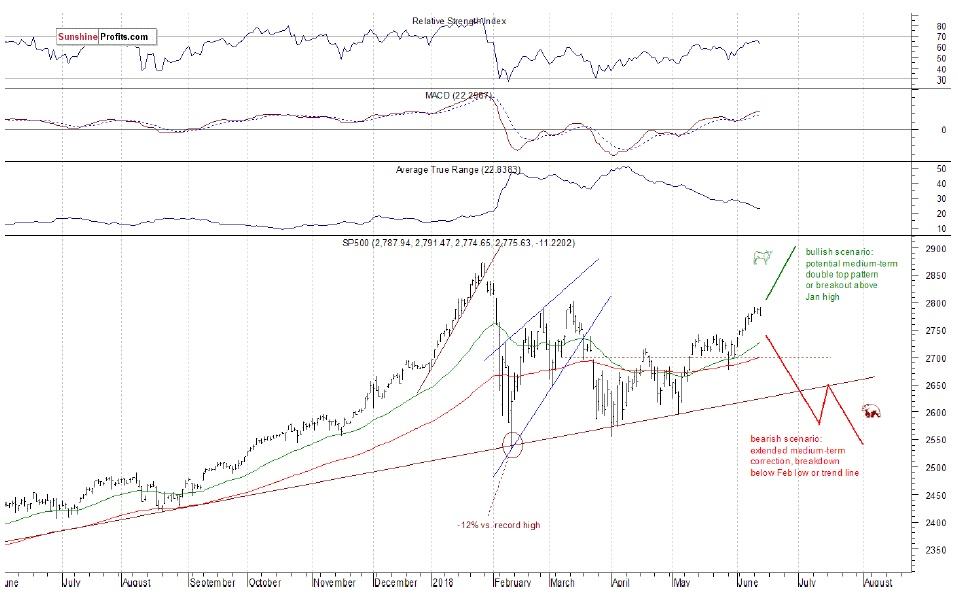
The U.S. stock market indexes lost between -0.1% and -0.5% on Wednesday, as investors reacted to the Fed's interest rate hike announcement. The S&P 500 index is still close to its mid-March local high of around 2,800. It currently trades 3.4% below January's 26th record high of 2,872.87. The Dow Jones Industrial Average lost 0.5%, and the technology Nasdaq Composite lost 0.1% yesterday.
The nearest important level of resistance of the S&P 500 index remains at around 2,7902,800, marked by the recent local highs along with mid-March local high. The next resistance level is at 2,830-2,840, marked by the late January short-term consolidation. On the other hand, support level is at 2,760-2,765, marked by the recent local lows. The next level of support is at 2,750, marked by previous level of resistance. The support level is also at 2,7352,740, marked by last week's Monday's daily gap-up of 2,736.93-2,740.54.
The broad stock market accelerated its short-term uptrend recently following the S&P 500 index' breakout above the resistance level of 2,750. Will it continue higher? We may see some more uncertainty and profit taking action, because the market is close to the resistance level of around 2,800. There are still two possible medium-term scenarios - bearish that will lead us below February low following trend line breakdown, and the bullish one in a form of medium-term double top pattern or breakout towards 3,000 mark. There is also a chance that the market will just go sideways for some time, and that would be positive for bulls in the long run (some kind of an extended flat correction):
Flat Expectations, but More Economic Data Ahead
Expectations before the opening of today's trading session are virtually flat, because the index futures contracts trade between -0.1% and 0.0% vs. their yesterday's closing prices. The European stock market indexes have lost 0.2-0.5% so far. Investors will wait for some economic data announcements: Retail Sales, Initial Claims, the ECB Press Conference at 8:30 a.m., Business Inventories at 10:00 a.m. The broad stock market will likely continue its short-term fluctuations along the above-mentioned resistance level of around 2,800. We may see another attempt at breaking higher despite yesterday's initial negative reaction to Fed's Rate Decision release. There have been no confirmed negative signals so far.
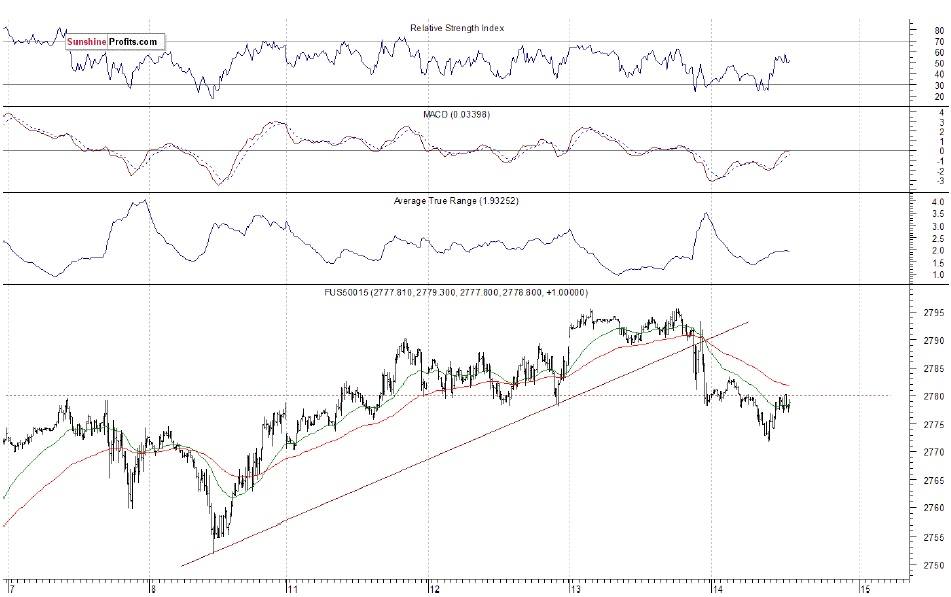
The S&P 500 futures contract trades within an intraday consolidation, as it fluctuates after an overnight decline. The nearest important level of resistance is at around 2,780-2,785, marked by the local highs. The next resistance level is at 2,795-2,800. On the other hand, support level is now at 2,770, marked by short-term local low. The support level is also at 2,7502,760. The futures contract trades slightly below its recent local lows, as the 15-minute chart shows:
Nasdaq Backs Off New Record High
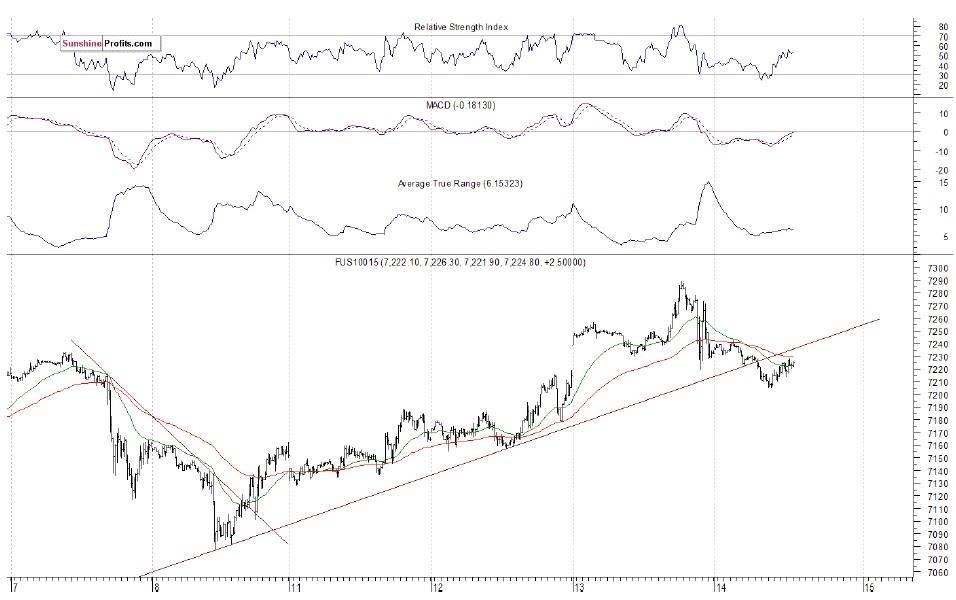
The technology Nasdaq 100 futures contract follows a similar path, as it bounces off an overnight low this morning. The market reached new all-time high yesterday, as it got closer to 7,300 mark. Then it fell to the level of 7,200. The nearest important level of support is at 7,150-7,200, marked by the recent fluctuations. The Nasdaq futures contract trades below its recent upward trend line, as we can see on the 15-minute chart:
Apple, Amazon - Close to Record Highs, Overbought?
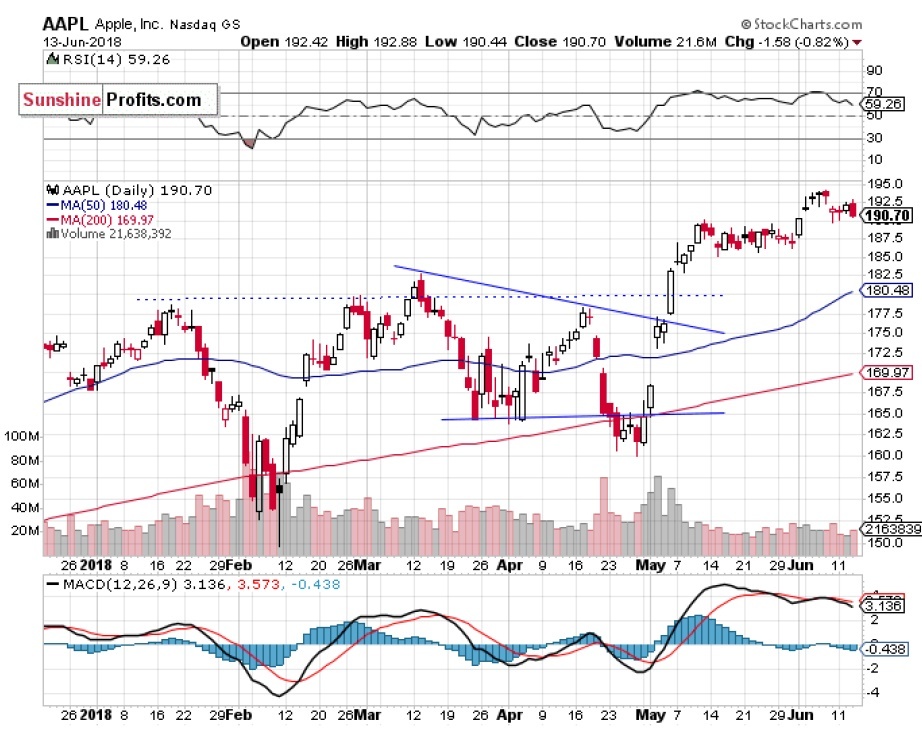
Let's take a look at Apple, Inc. stock (AAPL) daily chart. It reached new record high a week ago, as it slightly extended its short-term uptrend following last week's Monday's breakout above $190. Then the stock retraced some of its advance, as it fell closer to $190 again. Investors' sentiment remains bullish, but will the uptrend continue? There have been no confirmed negative signals so far. For now, it looks like a short-term consolidation:
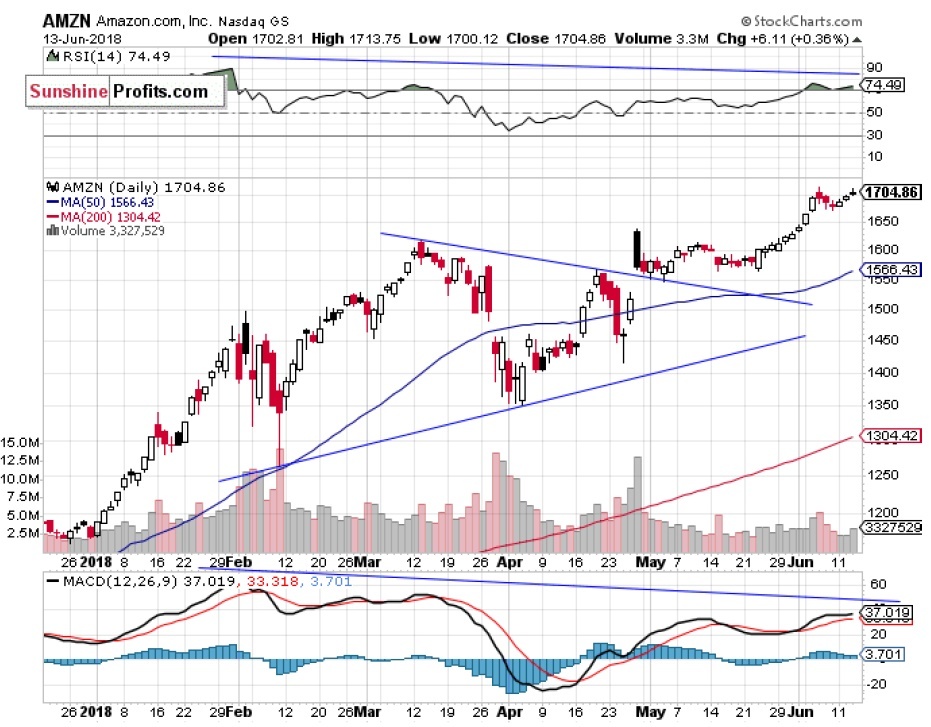
Now let's take a look at Amazon.com, Inc. stock (AMZN) daily chart. It came back to its last week's new record high yesterday, but it failed to continue higher. Is this a topping pattern before a downward reversal? There have been no confirmed negative signals so far. However, we can see some negative technical divergences. The nearest important level of resistance remains at around $1,715. On the other hand, support level is at $1,640, marked by the previous local high:
Dow Jones Continues Sideways
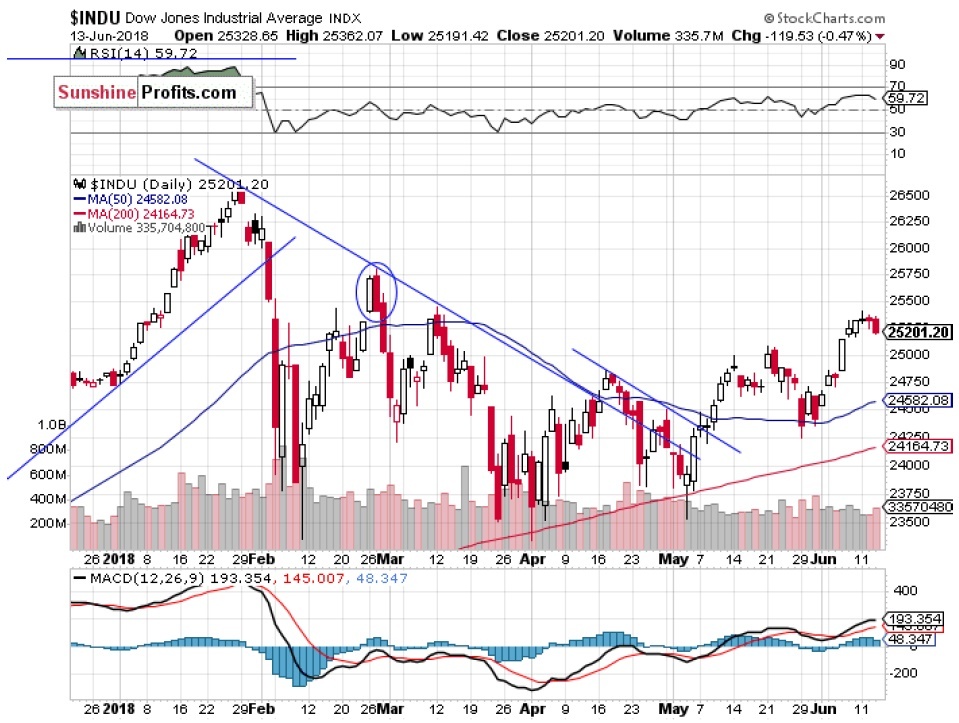
The Dow Jones Industrial Average fluctuated within a short-term consolidation yesterday. The blue-chip index remains above the level of 25,000 following its recent advance. Will the uptrend continue? There is a potential level of resistance at around 25,400-25,500, marked by mid-march local high. But there have been no confirmed negative signals so far:
The S&P 500 index trades within a short-term consolidation since Monday, as investors hesitate following last week's advance. Is this a topping pattern or just a flat correction before another leg higher? The market remains below the resistance level of around 2,800. For now, it looks like a correction within an uptrend, but if the index breaks below its recent local lows, it could accelerate lower.
Concluding, the S&P 500 index will likely open slightly lower to virtually flat following an overnight weakness. Will investors' sentiment improve later in the day? It's hard to say. We can see some more uncertainty, as the index trades just below the resistance level of 2,800. There have been no confirmed negative signals so far.
Want free follow-ups to the above article and details not available to 99%+ investors? Sign up to our free newsletter today!
Author

Paul Rejczak
Sunshine Profits
Paul Rejczak is a stock market strategist who has been known for the quality of his technical and fundamental analysis since the late nineties.


