Top Trade Setups in Forex - Dollar Weakens Ahead of Philly Fed!

The U.S. Dollar weakened for a third straight session on disappointing economic data. The ICE Dollar Index lost 0.4% on the day to a two-month low of 97.60.
U.S. official data showed that housing starts fell to an annualized rate of 1.256 million units in September (1.32 million units expected) from 1.386 million units in August. Industrial production declined 0.4% on month in September (-0.2% expected, +0.8% in August). Initial jobless claims increased to 214,000 for the week ended Oct. 12 (215,000 expected) from 210,000 in the prior week.
Later today, economists expect the U.S. leading index to stay flat.
European stocks were broadly lower, with the Stoxx Europe 600 easing 0.1%. Germany's DAX edged down 0.1%, and France's CAC dropped 0.4%, while the U.K.'s FTSE 100 was up 0.2 %.
USD/JPY - Sideways Range Remains Intact
The USD/JPY was closed at 108.637 after placing a high of 108.937 and a low of 108.452. The overall trend of USD/JPY remained Bearish for that day.
The Governor o Bank of Japan Haruhiko Kuroda said at the International Monetary Fund Meeting that if the risks over the prospects for hitting the price target were increased then, BOJ was ready to ease the monetary policy without hesitation further.
On the other hand, the Industrial Production and Manufacturing Production from the United States gave weaker than expected reports and weighed on Greenback. In response to this, the US Dollar Index dropped on Thursday; hence, USD/JPY also dropped.
At 1:00 GMT, the Treasury International Capital (TIC) Long-term Purchases from the US Department of Treasury came in negative for the month of September as -41.1B against 74.3B expectations.
At 17:30 GMT, the US Building House Permits came as 1.39M against 1.34M expectations and supported the US Dollar. On the other hand, the number of new Buildings that began construction in the month of September was 1.26M against 1.32M expectations weighed the US Dollar. The US job claims for September came as expected, 214K.
At 18:15 GMT, the Industrial Production for September was dropped to -0.4% against -0.1% expectations. The Capacity Utilization Rate also dropped to 77.5% against 77.7% expectations.
On the news front, Brexit remains under headlines on Thursday as European Union and the United Kingdom have finally reached on Brexit Deal. But PM Boris Johnson still needs to get support from UK Parliament in favor of this new deal. The news increased the risk factor in the market and decreased the safe-haven assets demand in the market.
-637069924741697844.png)
USD/JPY - Daily Technical Levels
| Support | Pivot Point | Resistance |
| 108 | 108.32 | 108.75 |
| 107.57 | 109.07 | |
| 106.81 | 109.82 |
USD/JPY - Daily Trade Sentiment
The USD/JPY continues to hold above 108.600 support level, having formed Doji candles, which are suggesting indecision among traders. The 50 periods EMA is also supporting the pair around 108.600 level, suggesting odds of a bullish bias in the pair. In contrast, the MACD is indicating bearish sentiment.
On the upper side, resistance stays at 108.800, and the violation of this level can extend the bullish trend until 109.20 today.
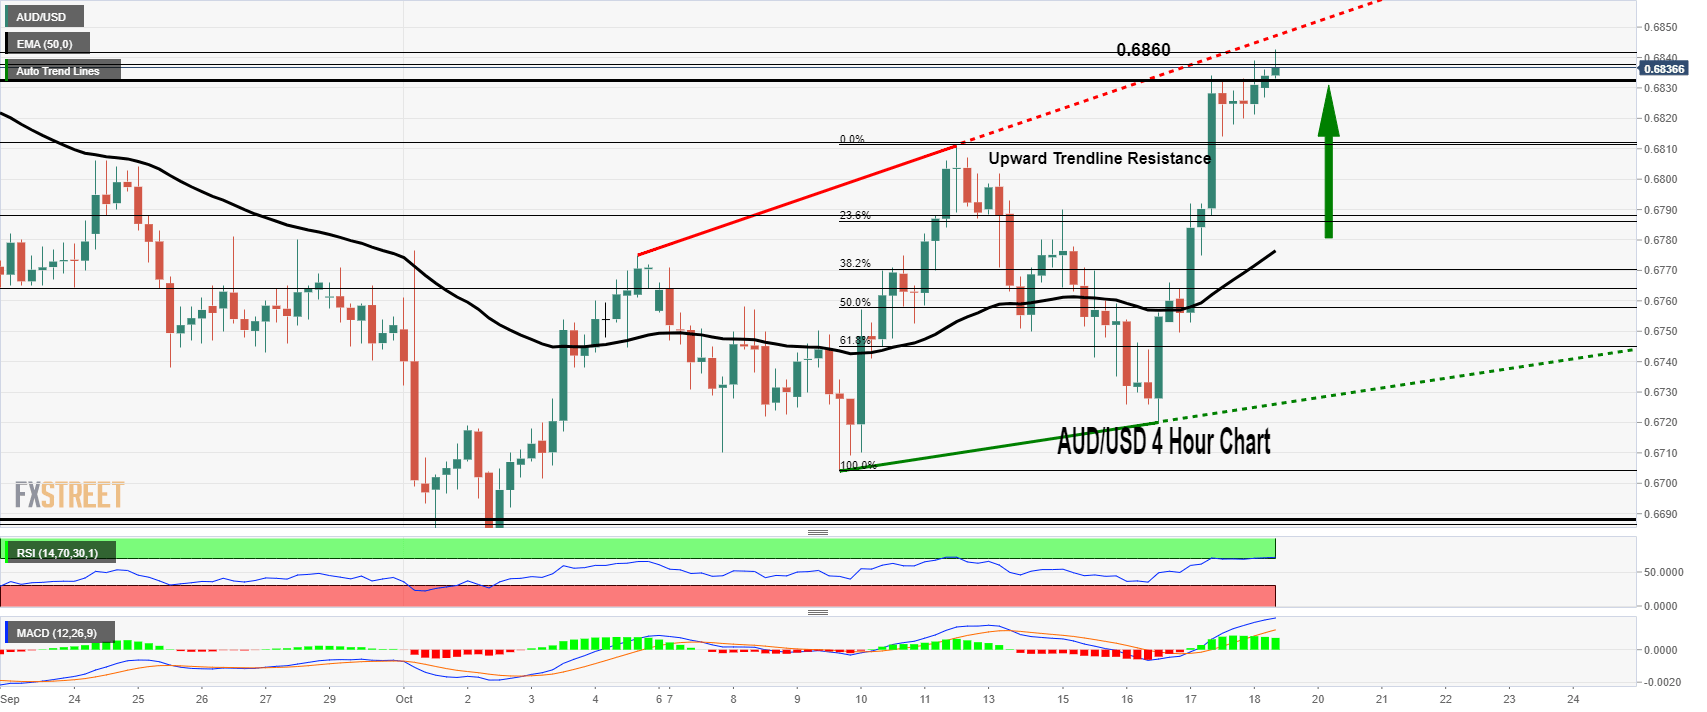
AUD/USD –Bullish Trend Line Resistance
AUD/USD was closed at 0.68211 after placing a high of 0.68329 and a low of 0.67512. The overall trend of AUD/USD remained Bullish for that day.
At 5:30 GMT, the Employment Change from the Australian Bureau of Statistics came in as 14.7K against the expectations of 15.3K.
The closely watched and long-awaited Unemployment Rate of Australia came in support of Aussie as 5.2% against the expectations of 5.3%. Traders reacted to the Unemployment Rate and started to buy Aussie on Thursday.
Though the number of jobs in September fell in Australia, the surprising fall in the unemployment rate of Australia decreased the investors’ bets on the November rate cut from Reserve Bank of Australia. RBA has cut its rates three times this year and has left the rate to 0.75% in October. The cut was made to lift the growth and inflation rate of Australia. US-China trade war has weighed on Australian as well as global economic growth and has been a factor for rate cuts from all the central banks.
The jobs have become a key driver for RBA decisions this year; the bank said that an increase in the unemployment rate would force it to cut its rates in the month of November until it achieves its full employment. RBA president Lowe said on Thursday that his team was still looking forward to December Rate cuts this year.
On the other hand, the upward trend of AUD/USD was further boosted up because of disappointing macroeconomic data of Housing Starts and Industrial Production from the United States.
AUD/USD - Technical Levels
| Support | Pivot Point | Resistance |
| 0.6791 | 0.6812 | 0.6849 |
| 0.6755 | 0.687 | |
| 0.6697 | 0.6697 |
AUD/USD - Daily Trade Sentiment
A day before, the AUD/USD has passed above the psychological trading level of 0.6800, and this presently opens possibilities of additional buying until 0.68400 level. Next to this, the bullish trendline is now extending substantial resistance at 0.6880 today. Consider trading bullish above 0.6812 to target 0.6880.
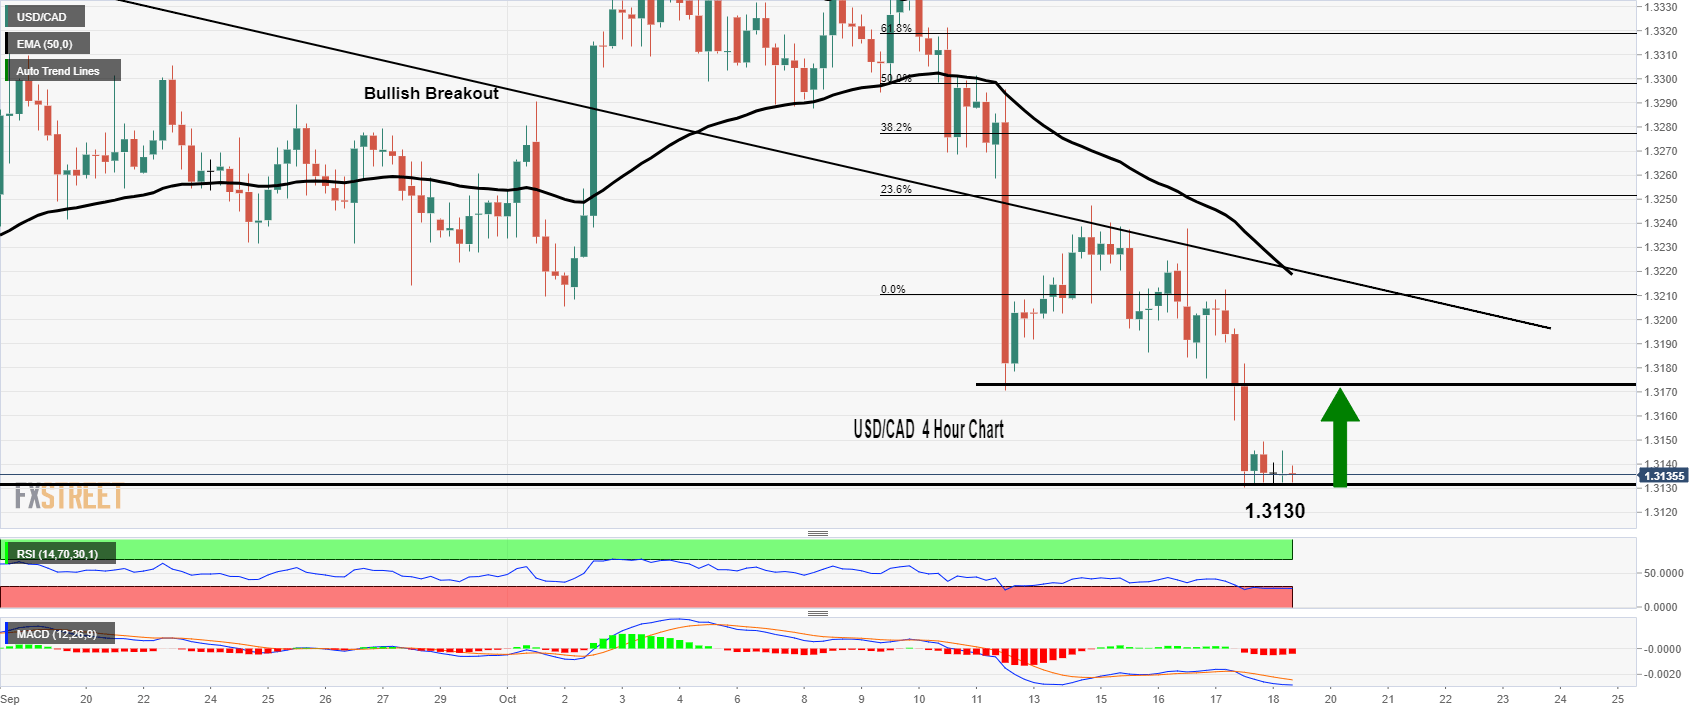
USD/CAD - Descending Triangle Breakout
The USD/CAD was closed at 1.31343 after placing a high of 1.32115 and a low of 1.31308. The overall trend of USD/CAD remained Bearish for that day.
At 17:30 GMT, the Manufacturing Sales for the month of September from Canada came 0.8% greater than expectations of 0.7% and supported Canadian Dollar. The ADP Non-Farm Employment Change from Canada showed a figure of 28.2K, which is less in comparison to the previous month’s 109.9K.
The data from the Canadian side didn’t have much effect on the movement of USD/CAD on Thursday. However, the US side data drove the USD/CAD in a downward direction after the release of weak and disappointing macroeconomic data.
The Housing Starts and Industrial Production of United States came in against US Dollar and weighed on Greenback amid the escalating hopes for the 3rd rate cut form Federal Reserve in the next meeting. Weak US Dollar drove USD/CAD in 5-weeks lowest level.
The fall in prices of USD/CAD was also caused by the US Crude Oil inventories report at 20:00 GMT, which came in as 9.3M against the expectations of 2.7M. The rise in inventories indicated weaker demand for Crude Oil Prices. As a result, the prices of Crude Oil spiked up on Thursday to $54. The increased oil prices supported the commodity-linked currency – Loonie, and weighed further on the prices of USD/CAD.
USD/CAD - Technical Levels
| Support | Pivot Point | Resistance |
| 1.3146 | 1.322 | 1.3269 |
| 1.3097 | 1.3344 | |
| 1.2974 | 1.3467 |
USD/CAD - Daily Trade Sentiment
The USD/CAD has traded in line with our forecast, having tested the next target level of 1.3130. The RSI and MACD are suggesting an oversold scenario, and this could trigger bullish retracement in the USD/CAD today.
The Doji and Spinning Top candlestick patterns may help bring buying in the USDCAD above 1.3130. The bullish target remains 1.3160 and 1.3175.
All the best for the U.S. session!
Author

EagleFX Team
EagleFX
EagleFX Team is an international group of market analysts with skills in fundamental and technical analysis, applying several methods to assess the state and likelihood of price movements on Forex, Commodities, Indices, Metals and


