Top Distribution Starting

Market Overview
Last week was a period of high volatility. Some will say it was news related, and they will be right! But it is also something that normally happens when cycles are peaking, and the news items which affect market prices in this manner are referred to as “catalysts”. This coincidence is a natural phenomenon of Nature, and something that cannot be readily explained; just observed. In the previous letter, I had mentioned that we needed to see the start of some price congestion as an indication that a top was forming. I had also mentioned that a reversal would probably occur in about two weeks. It looks as if this is arriving right on cue!
Last week’s SPX high of 2657 was probably only an interim projection. A slightly higher one to about 2668 may turn out to be the real target of the move which started at 1810, on January 2016 (7-year cycle low). It has given us quite a run, but there are other cycles that are now in the process of topping and which are not going to make it as easy as it has been to be bullish. If you want to read more about the current cyclic configuration, an excellent source would be Eric Hadik’s December Insiide Track ([email protected])
Chart Analysis(These charts and subsequent ones courtesy of QCharts)
SPX daily chart:
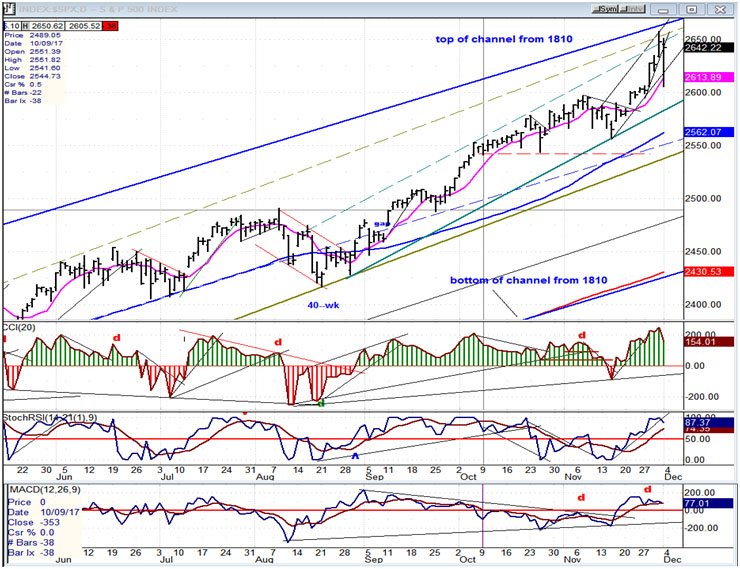
Last week, in a “news related atmosphere”, mainly the promise of “tax reform”, SPX moved exponentially into the top area of the projection target which originatedat the recently formed base of 2670 and, after started starting a normal enough correction, on Friday plunged 43 points in 26 minutes on another-- but negative this time -- news item. But the panic was quickly over and, by the close, the index had recovered all but seven points of its decline.
From a technical viewpoint, SPX found resistance when it reached (simultaneously) the junction of three different top channel lines, including that of the primary channel from 1810. It is probably a good bet that all three of these channels’ bottom lines will be breached over the next few weeks (and even months), as the market corrects the 847-point rally which started at 1810. Again, this reversal point is not expected to be the start of the next bear market, but only a normal, cycle-induced correction, which could bring, at a minimum, a .235 retracement of that entire uptrend, or about 200 points. This is only a loose approximation. We can derive a more specific projection from thesize of the entire top distribution pattern once it has been completed.
If we look at the oscillators at the bottom of the chart, the reversal will require a little more time to achieve. Our early bird A/D indicator (bottom of the chart) is the only one which is showing negative divergence. The other two are simply overbought and may have to produce some negative divergence as well, as the index makes its final high before they warn of an impending downturn. This would pre-suppose a minor correction in price followed by higher prices.
We have also entered one of the most bullish periods of the year, although there have been exceptions! And since the tax bill is not a done deal just yet, and other “negative news” could surface at any time, the rest of the year could turn out to be a mine field for equities.
…and, if we should start an important correction before the end of the year, will we really be able to say that the seventh year of the decennial pattern was a failure, this time???
SPX hourly chart:
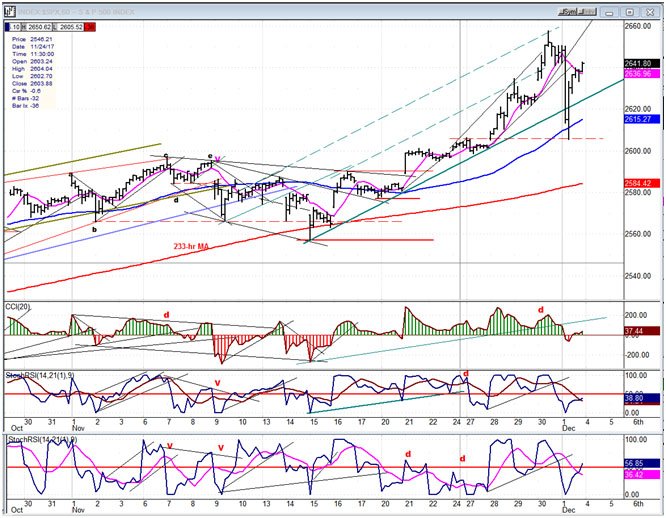
One can better appreciate the spontaneity of Friday’s decline on the 60m chart! Prices found support at a former peak,as well as with the 55-hr MA. But the non-technical explanation is that it soon became apparent that the negative news might turn out to be less severe than originally thought. This is, of course, for the future to decide, but since we are looking for the potential start of an important correction in the near future, this may only have been the first page of the next chapter!
All along, there have been plenty of bulls to buy the dips, and last week was no exception but, if I am right, we are coming to the end of that as a profitable endeavor as the risk of the dip continuing dipping lower after a brief bounce will increase. Most likely, the dip-buyers have been professional traders who are now ready to pass the baton to the amateurs
There was a minor cycle expected to make its low early next week, but this decline was way beyond its potential. If it still does make its low on schedule, it will be in the form of a pull-back after the rebound in prices. Of course, the passage of the senate version of the bill could push prices a little higher on Monday morning, but it could also bring some “selling on the news”.
Since we have already made an a-b-c projection, any pull-back should be limited, and form a re-accumulation pattern that will give us an indication of what comes next. The hourly oscillators are mixed and may require a more positive pattern before they are ready for another buy signal.
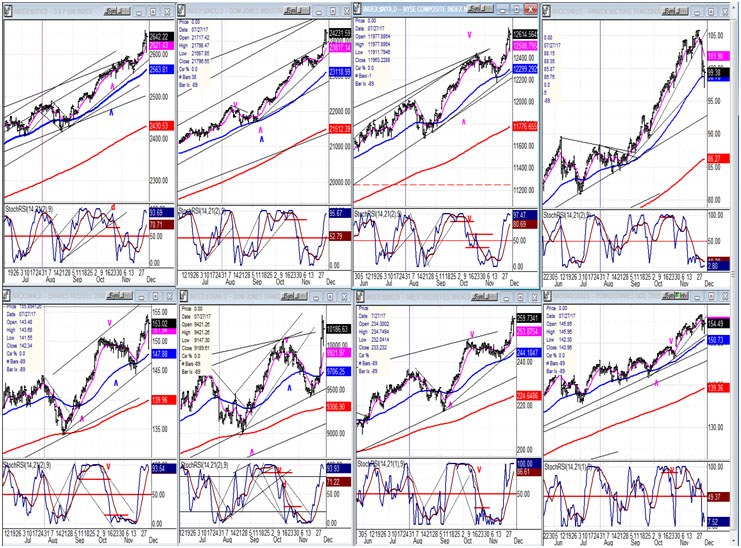
An overview of some important indexes (daily charts)
The value of following this group of indexes is becoming apparent. Note the digression of the tech representative (SMH, top right) from the rest of the group. Along with the FAANGS, techs were much weaker over the past week. But our former leaders, IWM and TRAN (bottom 1&2) held up relatively well after surging with the rest of the group. If these two conform to past behavior, they should start to show that we are approaching a top by beginning to decline ahead of the SPX, DJIA, and NYA (top 1,2,3).
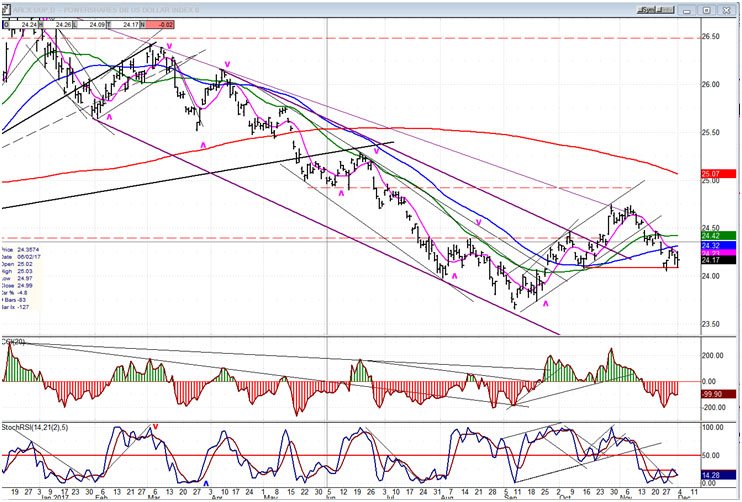
UUP (dollar ETF)
UUP is holding at former support and could do so for a little longer, but odds are that it will resume its decline before too long.
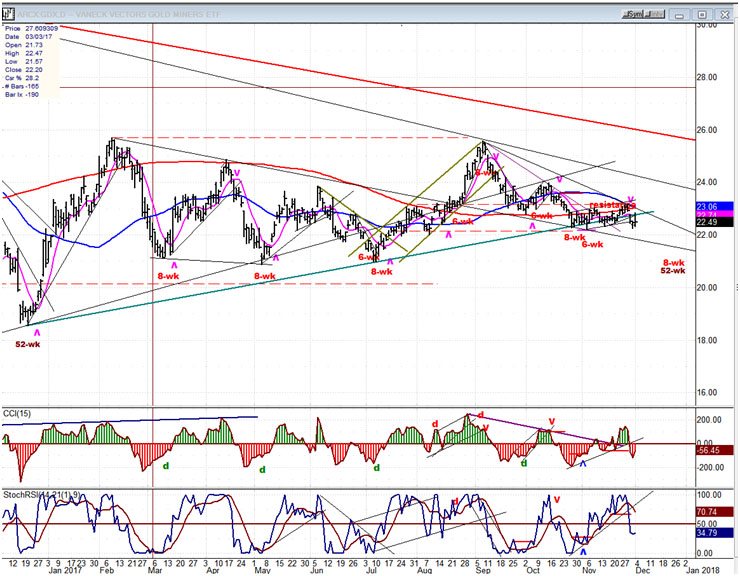
GDX (Gold miners ETF)
GDX has been neutralized by important cycles bottoming over the next two weeks, and has traded essentially sideways for the past six weeks. It is expected to move a little lower as these cycles make their lows, before starting a new uptrend.
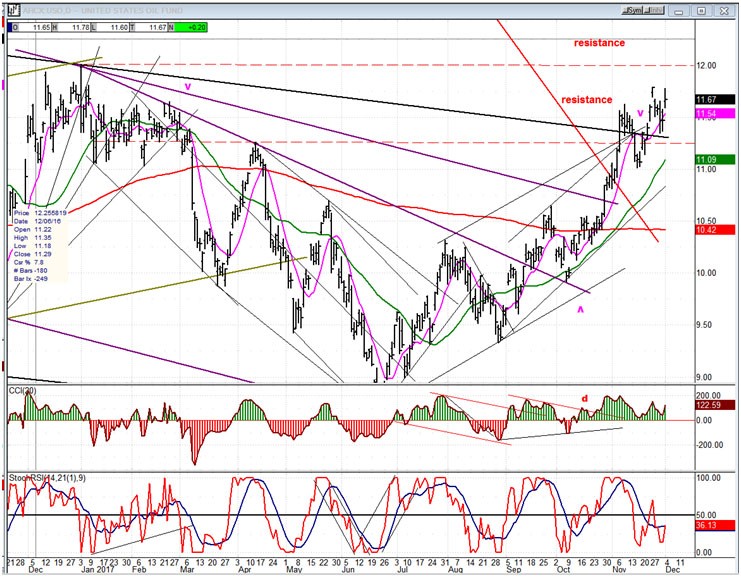
USO (United States Oil Fund)
USO continues to be on good behavior and is expected to reach its near-term count of 13.00 over the short-term, before starting a phase of consolidation.
Summary
Erratic and volatile behavior is often associated with important market tops. I believe that SPX is currently conforming with historical patterns.
Author

Andre Gratian
Market Turning Points
When I was a stock broker years ago, a friend introduced me to technical analysis of the market and it is not an exaggeration to say that I fell in love with this approach! Ever since then, it has become an increasingly important


