Top 3 Bitcoin, Litecoin & Ripple price analysis: No fears to new regulatory initiatives
- Regulatory pressures keep increasing in the Crypto industry as China will close the access to foreign trading platforms to its citizens
- SEC is initiating an investigation on ICOs to detect Ponzi schemes

Financial regulators keep trying to keep the Crypto sphere under their control, as news crossing the wires about new initiatives by regulatory institutions in China and the United States. China pretends to erase the legal void that allows their citizens to utilize foreign platforms to trade Cryptocurrencies. Chinese officials will enforce the freezing of banking accounts of particulars and companies involved in Crypto trading using these external platforms.
On the other hand, the SEC is studying the financial structures being used by the Crypto industry in their initial coin offers (ICOs). Their goal is to define under which conditions these operations can be realized to protect investors against Ponzi schemes. The ultimate goal seems to be establishing control mechanisms to a technology that, because of its decentralization, it's very difficult to supervise, as its core values are based on just being able to check some of the pieces of the puzzle without anybody being able to frame the whole picture.
Main Cryptocurrencies pause their price action
This kind of news doesn't seem to be having the same impact they used to have in the Crypto markets some weeks or months before, as the main Cryptocurrencies are following their main scenarios. The three Cryptos analyzed today (BTC/USD, LTC/USD and XRP/USD) are trading very close to important trend lines. They are not clearly defined but let's see their different technical outlooks.
XRP/USD 4H chart
-636554993845150057.png)
Ripple shows bigger weakness than the other Cryptocurrencies analyzed. The losses suffered during the last 10 days have resulted in a loss of momentum and now XRP/USD is trading around a difficult area, with bearish lateral action. This is the only one in the trio analyzed that is not trading inside a bullish formation.
MACD in the Ripple 4-hour chart is moving very close to the 0 line, but still inside negative territory. It seems very complicated that this indicator might break out to the upside, as it lacks inclination, so any bullish initiative will not look clean and will need a considerable amount of time to develop.
Directional Movement Index shows the sellers clearly outnumbering buyers. ADX seems to be beginning to react to this new reality moving down to the level of 20, right where it gives the signal of trend strength when it is crossed up.
On the upside, first resistance is at $1, followed by the ceiling of the bearish channel at $1.07, which looks like the key level to break for bulls if they want to turn around the outlook in their favor. If that level is broken, next target would be at the recent highs at $1.2288.
On the downside, first support has already been broken at $0.8515, and if that is lost, it would take the price quickly to the base of the channel at $0.55. Below there, doors are open to very important falls with a brand new scenario.
Litecoin still with room inside the current formation, bullish outlook
Litecoin is trading inside a bullish formation, taking the retracement 38.2% Fibonacci retracement from the previous fall as an equilibrium point. It has been trading several days around this level while it looks to define its next steps.
LTC/USD 4H chart
-636554994293161930.png)
MACD in the Litecoin 4-hour chart is quite similar to the one presented in Ripple, which takes out some strength to the outlook. The bright spot here is that it has a bit more of inclination, so in case of a bullish movement, it might have greater bigger odds of successfully breaking out.
Directional Movement Index also shows an edge to the sellers, but here ADX has not reacted and is still at very low levels, so there is no indication of selling strength. On the other hand, buyers have been increasing their activity in the last hours without challenging the advantage of the sellers.
On the upside, first resistance is at $238.53, the 50% Fibonacci retracement, followed by $253, the roof of the current bullish channel. Next target, the last one preventing a new bullish leg, the 61.8% Fibonacci retracement from highs at $270.69.
On the downside, the first support is at $192.78, followed by the 23.6% Fibonacci retracement from highs at $166.56. If that level is lost, an important support is located around $142.
Bitcoin much more prepared for bullish action in the short term
BTC/USD 4H chart
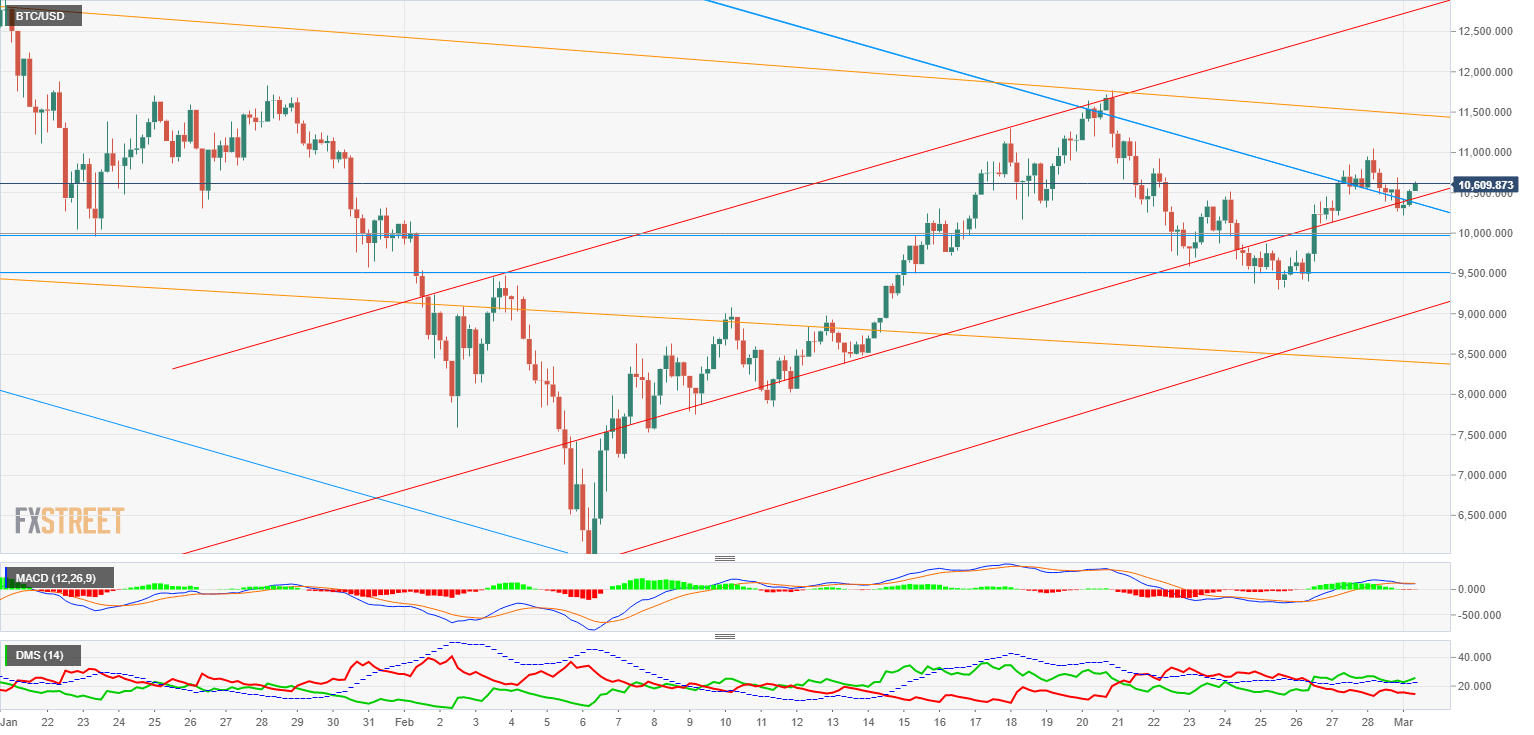
From the three Cryptocurrencies analyzed in this article, Bitcoin is the one best placed to get on a new bullish leg. We still need to consider that a sudden bearish action would take Bitcoin price back to $8300 and close the head&shoulders pattern, freeing it from any technical commitments. That said, the current technical outlook seems much more keen to new rises.
MACD in the Bitcoin 4-hour chart is trading above the 0 line and now shows a favorable profile for a new bullish leg.
Directional Movement Index is completely different than the one we see in the other Cryptos analyzed, with buyers staying in control while sellers are progressively diminishing. ADX is at low trend levels and looks to keep the D+ movement, which would increase the bullish potential.
On the upside, first resistance is at $11430, followed by $11740, right where it set a high for the current bullish movement. At last, the $12890-$13000 area is next target, the roof of the bullish channel ruling the current movement from lows.
On the downside, the first support is at $9990, followed immediately by $9539. At last, the ultimate target is at the base of the channel around $9000: a break below that level would provide a change of scenario.
Author

Tomas Salles
FXStreet
Tomàs Sallés was born in Barcelona in 1972, he is a certified technical analyst after having completing specialized courses in Spain and Switzerland. He expanded his technical training following the guidance of great experts on the financial markets.


