USD: Dec '24 is Up at 106.515.

Energies: Jan '25 Crude is Up fractionally at 70.05.

Financials: The Mar '25 30 Year T-Bond is Down 18 ticks and trading at 118.20.

Indices: The Dec '24 S&P 500 emini ES contract is 70 ticks Higher and trading at 6080.50.

Gold: The Feb'25 Gold contract is trading Down at 2664.30.

Initial conclusion

This is not a correlated market.  The USD is Up and Crude is Up which is not normal, but the 30 Year T-Bond is trading Lower.  The Financials should always correlate with the US dollar such that if the dollar is Higher, then the bonds should follow and vice-versa. The S&P is Higher and Crude is trading Higher which is not correlated. Gold is trading Lower which is correlated with the US dollar trading Up.  I tend to believe that Gold has an inverse relationship with the US Dollar as when the US Dollar is down, Gold tends to rise in value and vice-versa. Think of it as a seesaw, when one is up the other should be down. I point this out to you to make you aware that when we don't have a correlated market, it means something is wrong. As traders you need to be aware of this and proceed with your eyes wide open. Asia traded Mixed.  All of Europe is trading Higher with the exception of the London exchange. 

Possible challenges to traders

  • ADP Non-Farm Employment Change is out at 8:15 AM EST. This is Major.

  • FOMC Member Musalem Speaks at 8:45 AM EST. This is Major.

  • Final Services PMI is out at 9:45 AM EST. This is Major.

  • ISM Services PMI is out at 10 AM EST. This is Major.

  • Factory Orders m/m is out at 10 AM EST. This is Major.

  • Crude Oil Inventories is out at 10:30 AM EST. This is Major.

  • Fed Chair Powell Speaks at 1:45 PM EST. This is Major.

  • Beige Book is out at 2 PM EST. This is Major.

Traders, please note that we've changed the Bond instrument from the 10 year (ZN) to the 2 year (ZT).  They work exactly the same.  

We've elected to switch gears a bit and show correlation between the 2-year Treasury notes (ZT) and the S&P futures contract.  The YM contract is the Dow Jones Industrial Average, and the purpose is to show reverse correlation between the two instruments.  Remember it's likened to a seesaw, when up goes up the other should go down and vice versa.

Yesterday the ZT migrated Higher at around 8:30 AM EST with no economic news pending.  The Dow migrated Lower at the same time.  Look at the charts below and you'll see a pattern for both assets. The Dow moved Lower at 8:30 AM and the ZT moved Higher at around the same time.  These charts represent the newest version of Bar Charts, and I've changed the timeframe to a 15-minute chart to display better.  This represented a Long opportunity on the 2-year note, as a trader you could have netted about a dozen ticks per contract on this trade.   Each tick is worth $7.625.  Please note: the front month for ZT is now Mar '25 and the Dow is still Dec '24.  I've changed the format to filled Candlesticks (not hollow) such that it may be more apparent and visible.

Charts courtesy of barcharts

ZT

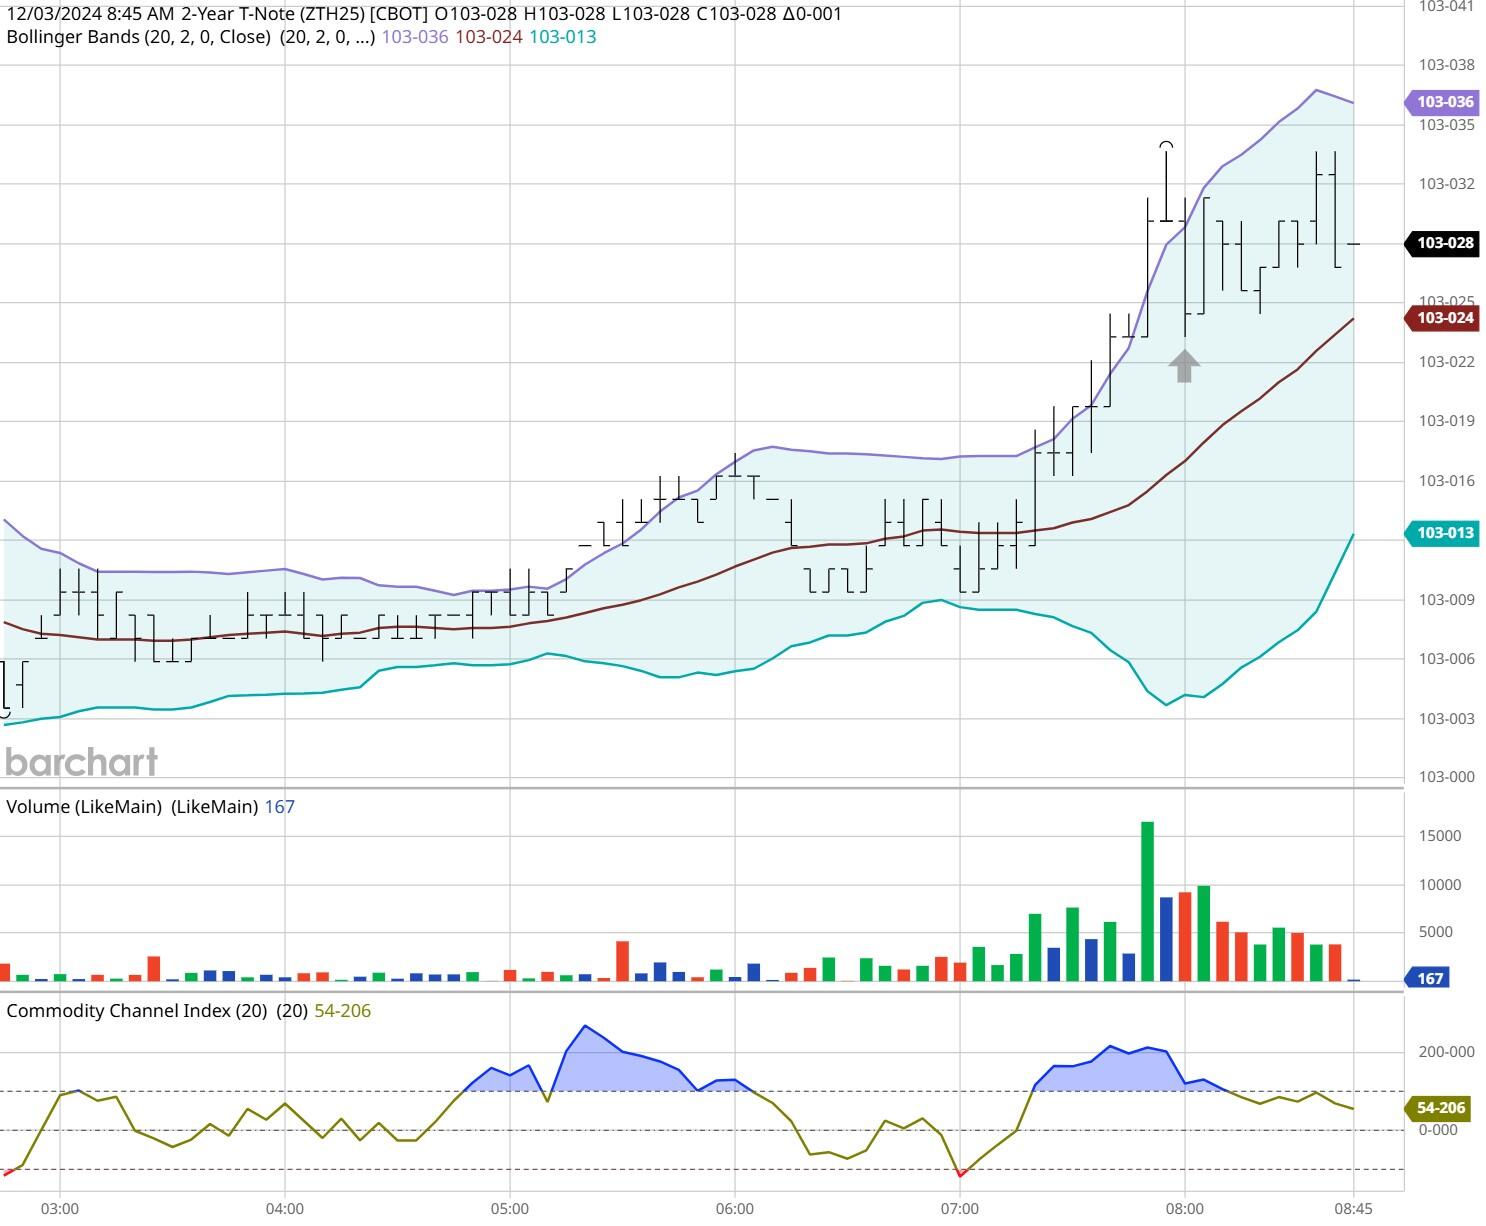
ZT -Mar 2025 - 12/03/24

Chart

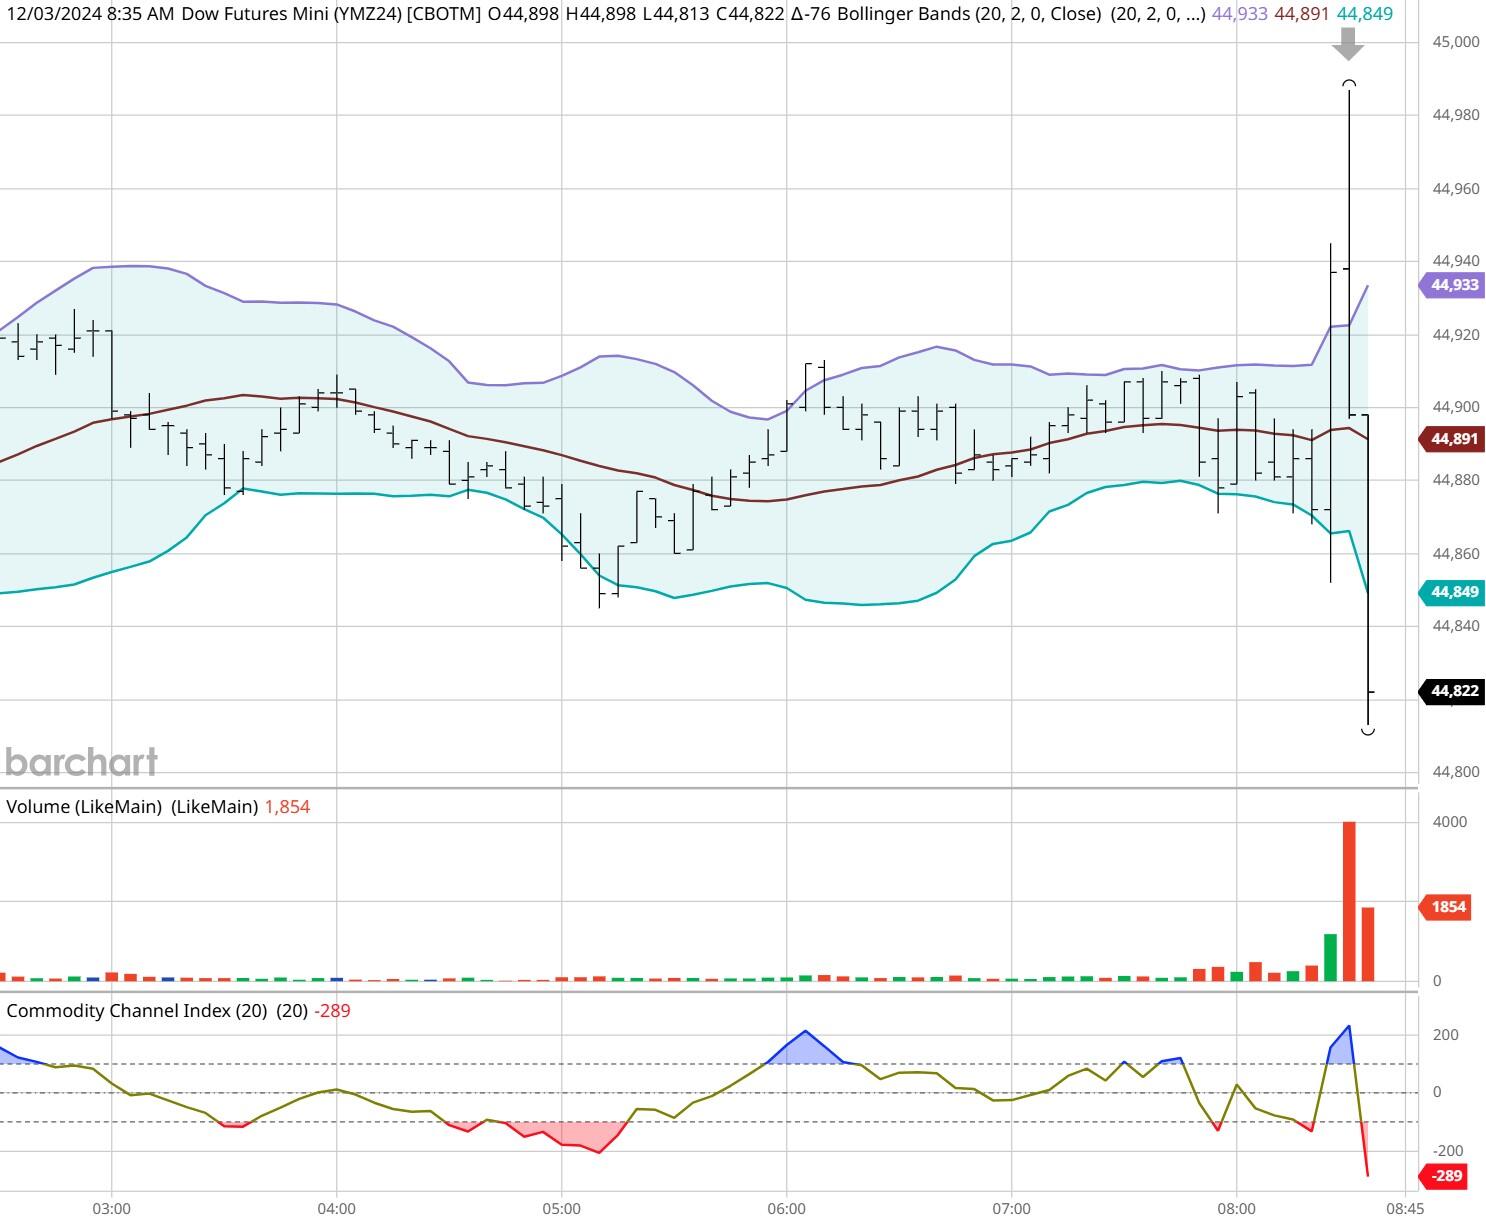
Dow - Dec 2024- 12/03/24

Bias

Yesterday we gave the markets an Upside bias as both the USD and the Bonds were Lower Tuesday morning. The Dow closed Lower by 76 points, but the S&P and Nasdaq both migrated Higher.  Today we aren't dealing with a correlated market, and our bias is to the Upside.

Could this change? Of Course. Remember anything can happen in a volatile market.

Commentary

Yesterday the markets traded mainly Higher, but the Dow migrated Lower.  All in all, it was a mixed day but today we have the Beige Book and Chairman Powell will be speaking.  Hopefully he may give us some insight as to what the Federal Reserve is planning to do or at the very least might do. Will he do this?  Only time will tell.
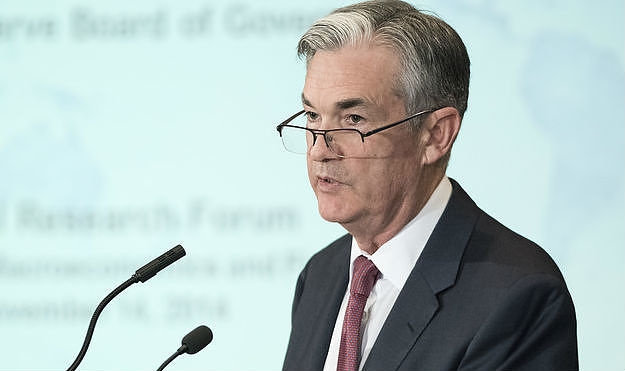
Trading performance displayed herein is hypothetical. The following Commodity Futures Trading Commission (CFTC) disclaimer should be noted.

Hypothetical performance results have many inherent limitations, some of which are described below. No representation is being made that any account will or is likely to achieve profits or losses similar to those shown.

In fact, there are frequently sharp differences between hypothetical performance results and the actual results subsequently achieved by any particular trading program. One of the limitations of hypothetical performance trading results is that they are generally prepared with the benefit of hindsight.

In addition, hypothetical trading does not involve financial risk, and no hypothetical trading record can completely account for the impact of financial risk in actual trading. For example, the ability to withstand losses or to adhere to a particular trading program in spite of trading losses are material points which can also adversely affect actual trading results.

There are numerous other factors related to the markets in general or to the implementation of any specific trading program which cannot be fully accounted for in the preparation of hypothetical performance results and all of which can adversely affect actual trading results.

Trading in the commodities markets involves substantial risk and YOU CAN LOSE A LOT OF MONEY, and thus is not appropriate for everyone. You should carefully consider your financial condition before trading in these markets, and only risk capital should be used.

In addition, these markets are often liquid, making it difficult to execute orders at desired prices. Also, during periods of extreme volatility, trading in these markets may be halted due to so-called “circuit breakers” put in place by the CME to alleviate such volatility. In the event of a trading halt, it may be difficult or impossible to exit a losing position.

Recommended Content


Recommended Content

Editors’ Picks

AUD/USD clings to recovery gains above 0.6150 after Chinese trade data

AUD/USD clings to recovery gains above 0.6150 after Chinese trade data

AUD/USD is finding its feet in the Asian session on Monday, holding recovery above 0.6150 from over four-year troughs. China's pro-growth measures and strong Chinese December trade data underpin the Aussie amid a broadly risk-averse market environment and persistent US Dollar strength.

AUD/USD News
USD/JPY remains pressured near 157.00 amid risk aversion

USD/JPY remains pressured near 157.00 amid risk aversion

USD/JPY stays pressured near 157.50 early Monday, having reversed from near 158.00 region in the last hours. Risk-off sentiment on hawkish Fed expectations and US economic resilience weigh on markets, reviving the safe-haven appeal of the Japanese Yen amid looming BoJ rate hike risks. 

USD/JPY News
Gold: Buyers face exhaustion below $2,700

Gold: Buyers face exhaustion below $2,700

Gold price trades with mild losses near $2,690 on the stronger US Dollar in the Asian session on Monday. However, the safe-haven demand due to uncertainty surrounding the President-elect Donald Trump administration's policies might help limit the Gold’s losses. 

Gold News
Week ahead: US CPI and China GDP in focus, UK data eyed too as Pound skids

Week ahead: US CPI and China GDP in focus, UK data eyed too as Pound skids

US inflation report to take centre stage as Dollar remains well bid. China’s economic policies to come under scrutiny as Q4 GDP on tap. UK CPI and GDP figures to be watched as Pound’s pain worsens.

Read more
Think ahead: Mixed inflation data

Think ahead: Mixed inflation data

Core CPI data from the US next week could ease concerns about prolonged elevated inflation while in Central and Eastern Europe, inflation readings look set to remain high.

Read more
Best Forex Brokers with Low Spreads

Best Forex Brokers with Low Spreads

VERIFIED Low spreads are crucial for reducing trading costs. Explore top Forex brokers offering competitive spreads and high leverage. Compare options for EUR/USD, GBP/USD, USD/JPY, and Gold.

Read More

Majors

Cryptocurrencies

Signatures