To recede or not to recede

USD: Mar '25 is Down at 103.590.
Energies: Apr '25 Crude is Up at 66.76.
Financials: The Jun '25 30 Year T-Bond is Lower by 3 ticks and trading at 117.26.
Indices: The Mar '25 S&P 500 emini ES contract is 40 ticks Higher and trading at 5632.00.
Gold: The Apr'25 Gold contract is trading Up at 2917.60.
Initial conclusion
This is not a correlated market. The USD is Down and Crude is Up which is normal, and the 30 Year T-Bond is trading Lower. The Financials should always correlate with the US dollar such that if the dollar is Higher, then the bonds should follow and vice-versa. The S&P is Higher and Crude is trading Higher which is not correlated. Gold is trading Higher which is correlated with the US dollar trading Down.I tend to believe that Gold has an inverse relationship with the US Dollar as when the US Dollar is down, Gold tends to rise in value and vice-versa. Think of it as a seesaw, when one is up the other should be down. I point this out to you to make you aware that when we don't have a correlated market, it means something is wrong. As traders you need to be aware of this and proceed with your eyes wide open. All of Asia traded Lower except the Nikkei exchange. All of Europe is trading Lower.
Possible challenges to traders
-
NFIB Small Business Index is out at 6 AM EST. This is Major.
-
Jolts Job Openings is out at 10 AM EST. This is Major.
Traders, please note that we've changed the Bond instrument from the 10 year (ZN) to the 2 year (ZT). They work exactly the same.
We've elected to switch gears a bit and show correlation between the 2-year Treasury notes (ZT) and the S&P futures contract. The YM contract is the Dow Jones Industrial Average, and the purpose is to show reverse correlation between the two instruments. Remember it's likened to a seesaw, when up goes up the other should go down and vice versa.
Yesterday the ZT Migrated Higher at around 8 AM EST with no economic news in sight. The Dow moved Lower at the same time. Look at the charts below and you'll see a pattern for both assets. The Dow moved Lower at 8 AM EST and the ZT moved Higher at around the same time. These charts represent the newest version of Bar Charts, and I've changed the timeframe to a 15-minute chart to display better. This represented a Long opportunity on the 2-year note, as a trader you could have netted about 30 plus ticks per contract on this trade. Each tick is worth $7.625. Please note: the front month for ZT is now Jun '25 and the Dow is still Mar '25. I've changed the format to filled Candlesticks (not hollow) such that it may be more apparent and visible.
Charts courtesy of BarCharts
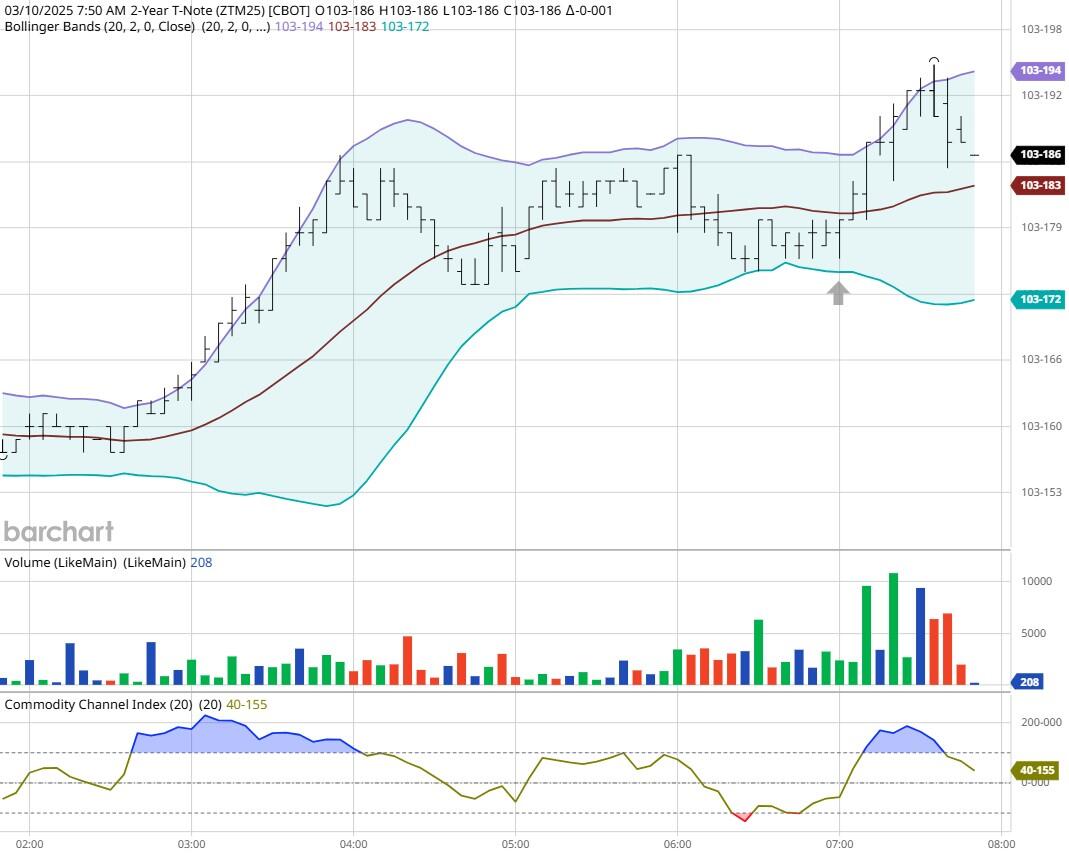
ZT -Jun 2025 - 3/10/25
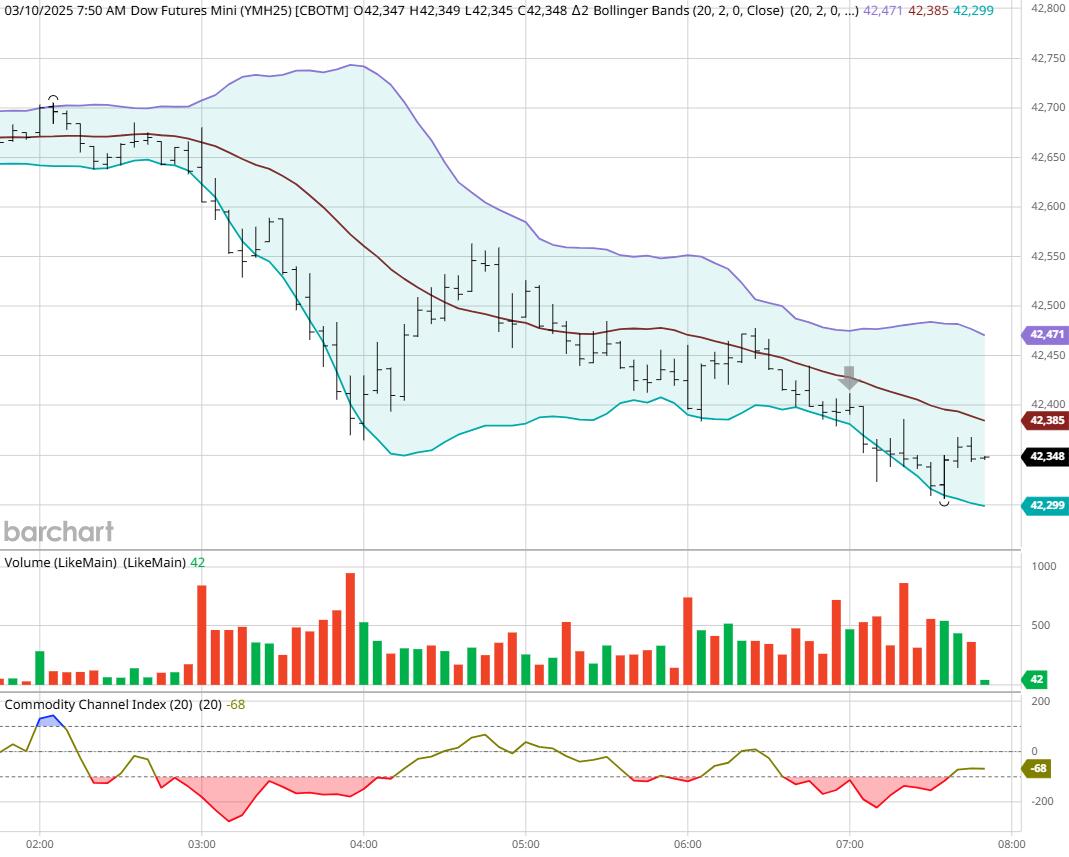
Dow - Mar 2025- 3/10/25
Bias
Yesterday we gave the markets a Downside bias and the markets didn't disappoint. The Dow dropped 890 points on the session and the other indices lost ground as well. Today we aren't dealing with a correlated market, and our bias is to the Upside.
Could this change? Of Course. Remember anything can happen in a volatile market.
Commentary
I know we called for a Downside bias yesterday but enough is enough. I haven't seen a market drop like that in years. I think it was closer to, or 1,000 points Lower at its peak. And all because our president couldn't answer a question posed by Fox News if we will be having a recession or not. Want to learn Market Correlation and determine market direction hours before the Opening Bell?
Author

Nick Mastrandrea
Market Tea Leaves


