This two-tiered economy has two inflation stories: Gold/Stocks vs. Lumber/Copper

If you have spent any time on social media, you’ve likely run across the stunning lumber futures charts and the strong opinions on what this might be signaling about the state of the economy. You’ve likely also encountered posts about the risks of another wave of inflation. Like politics, market opinions have become highly polarized and emotional. Ironically, both narratives can, and are, true. We are living in a time of both deflation and inflation simultaneously, depending on which assets or products you are looking at.
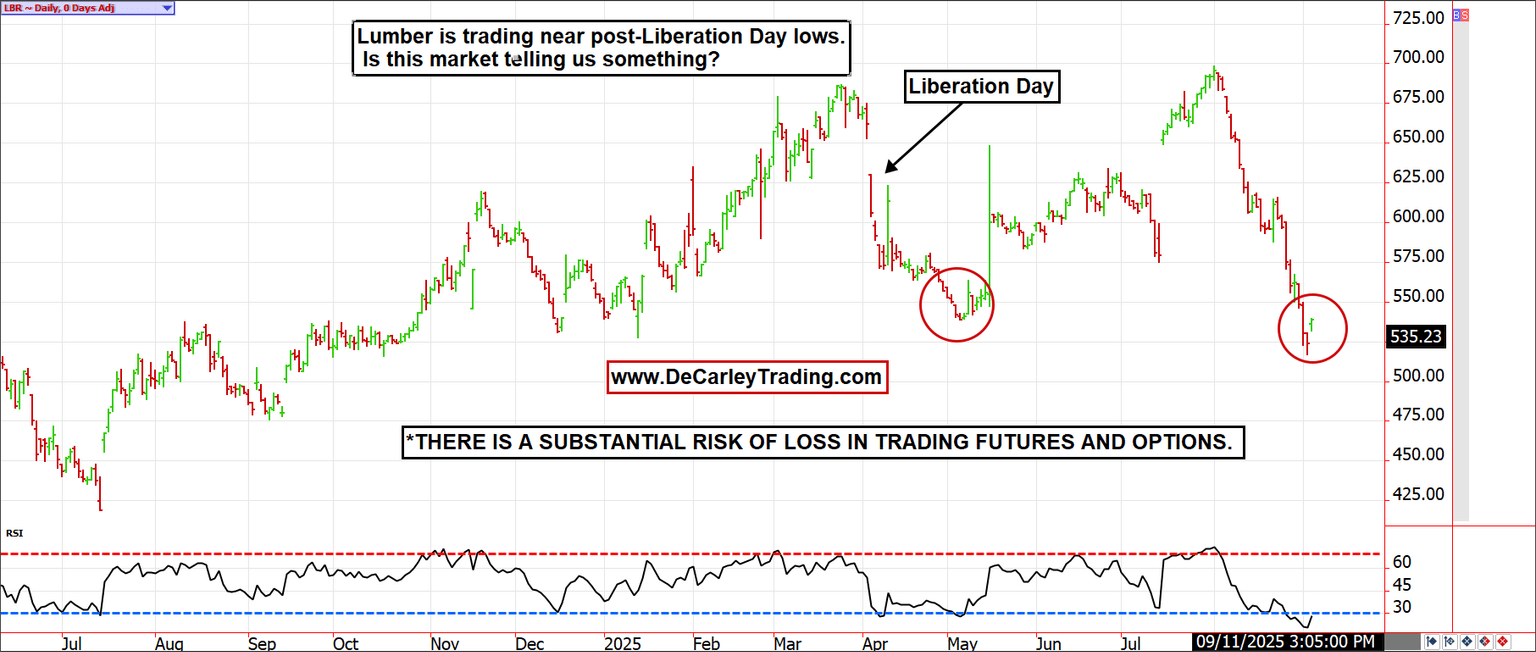
We will start with lumber futures, which have quickly fallen back to post-Liberation Day lows. This chart clearly suggests a slowing demand for lumber and the presence of deflationary forces. If you recall, April was a month in which markets were pricing in their worst-case scenario for tariff consequences. While lumber futures aren’t the most liquid product in the world, that might mean they are a more reliable gauge of how the economy is doing underneath the hood. In other words, lumber futures aren’t benefiting from excessive investor and speculator cash injections.
The stock market and the economy are two different animals; one can be thriving while the other is languishing. If the economy were running hot and inflation was a concern, as the S&P 500 and gold valuation would suggest, we wouldn’t see copper trolling the lower end of its trading channel.

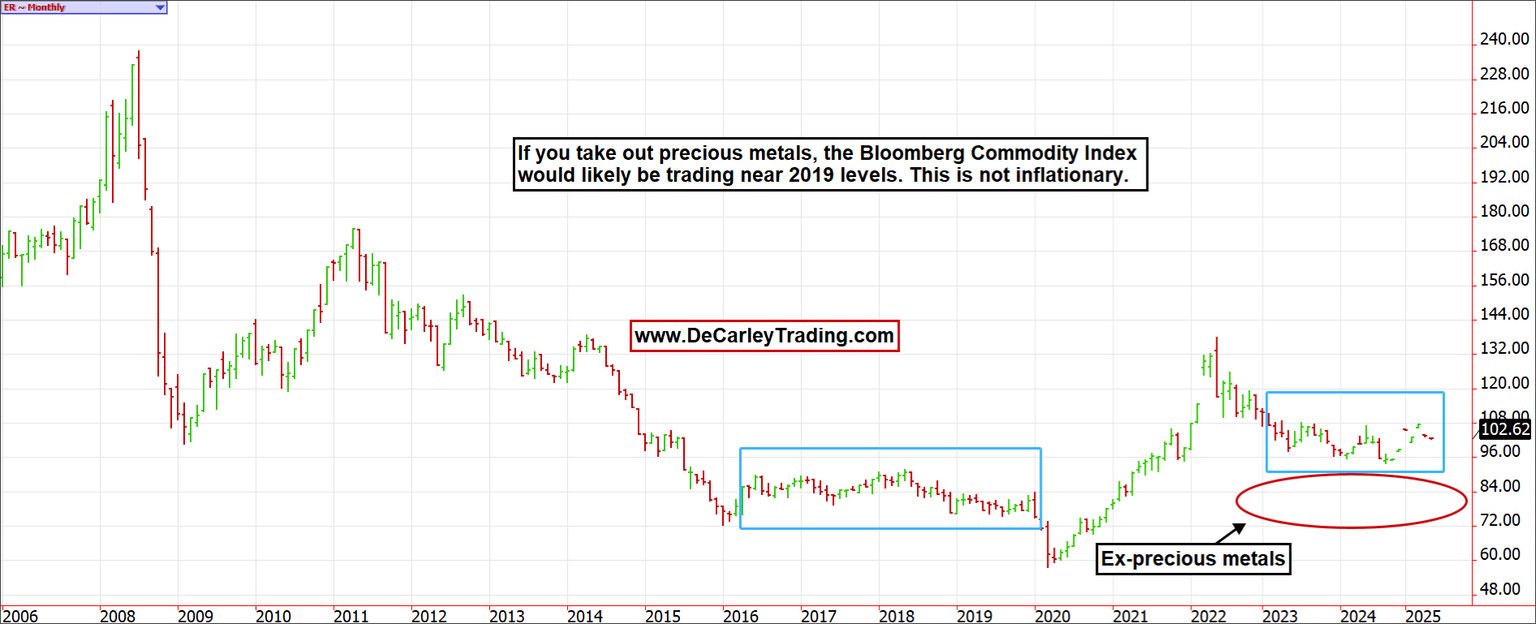
Next, let’s look at the Bloomberg Commodity Index. This index is composed of a basket of commodities, including energy, grains, meats, and both industrial and precious metals. Even as the index stands, it is hard to make a case for commodity inflation based on this chart. But if we remove the precious metals category from the equation, a complex that has significantly benefited from liquidity injections and investment allocation since the pandemic, the index is likely hovering near its 2019 valuation.
Yet, while the commodity markets are mostly in a deflationary cycle, suggesting contraction, economic participants with too many dollars chasing too few assets have pushed the prices of risk assets (stocks, crypto, gold), houses, and desirable goods (electronics, cars, vacations, and eating out) to what would have been unfathomable levels just five years ago.
Unlike the aforementioned commodity charts, a monthly look at the three hottest asset classes in finance paints a much different picture. Before the pandemic stimulus, gold, stocks, and Bitcoin were relatively uncorrelated and unrelated. It wasn’t until Central Banks around the world shot a bazooka of liquidity into the economy that the asset inflation era came to light. Those who are allocating funds to Bitcoin or gold in hopes of gaining diversification might not get what they are bargaining for. Each of these assets has benefited simultaneously from an increased money supply. As a result, they are all acting as correlated risk assets. Either the asset expansion continues, or they all roll over together. I doubt there are many other scenarios.

While central banks around the world are getting the brunt of the blame for flooding the system with cash, banks have also played a large role in money creation. According to Richard Werner, a German economist, the banks are the primary, not secondary, creators of money via credit card issuance and even the way loans for homes and cars are accounted for. He claims that just because the bank is lending one person money, it doesn’t mean that money is on deposit from another customer. In any case, loosey goosey money creation has created a two-tiered economy in which assets that are generally needed for economic expansion and growth, such as copper and energy, are behaving deflationary. Still, assets that benefit from investment dollars, such as Bitcoin, stocks, and gold, are being artificially inflated.
Lastly, consumers have relied on credit and leverage to live beyond their means, which keeps prices high for items we consider necessities, but less developed societies would view as luxuries. A few examples are DoorDashing dinner, high-end phones, travel expenses, and concert tickets. Can you believe a single nose-bleed category seat to see a popular act at the Sphere in Las Vegas will run you close to $1,000, and if you want a cocktail while you are there, you can add another $50.00 after tip.
It is my belief that there are large swaths of the population who are carrying large credit card balances, taking out seven-year loans for luxury vehicles, and living house poor; rather than using excess cash to pay down debt, they are investing the money into assets they believe will offer a return in excess of the interest charges on their loans. In other words, high-flying risk assets are inherently financed with leverage. Who can blame them? At the moment, the math works out in their favor, and online influencers are insulting the intelligence of anyone living debt-free or holding Treasuries or cash.
I’ve lived through a cycle in which this mindset was prevalent and even mainstream. It was 2006 and 2007, on the Eve of the financial crisis. When leveraged consumers and investors were forced to deal with declining asset prices, the math no longer made sense. In fact, it was devastating. We don’t know whether or not we get a repeat of that, but we have to acknowledge that all of the pieces are aligning for the potential of a repeat, and we must manage our risks accordingly.
Author

Carley Garner
DeCarley Trading
Carley Garner is an experienced commodity broker with DeCarley Trading, a division of Zaner, in Las Vegas, Nevada. She is also the author of multiple books including, “Higher Probability Commodity Trading” and “A Trader's First Book on Commodities”.


