The Verge of 'Overheating' Labor Market in Pictures

Economist Mark Zandi fears the tight jobs market may "overheat". In the Beige Book, the word "tight" came up 31 times.
Ahead of the last jobs report, Mark Zandi, chief economist of Moody’s Analytics, offered this amusing comment as noted by ADP: “The job market ended the year strongly. Robust Christmas sales prompted retailers and delivery services to add to their payrolls. The tight labor market will get even tighter, raising the specter that it will overheat.”
For further discussion, please see December Jobs Up 148K Following ADP 250K "Overheating" Estimate
Turning the spotlight on the Beige Book Drivel I went back to the report and counted 31 instance of the word tight.
Here is a representative sample "Most Districts cited on-going labor market tightness and challenges finding qualified workers across skills and sectors, which, in some instances, was described as constraining growth."
Tight Labor Market Theory
The "tight" labor theory concern is that employees will job hop, demanding higher and higher wages, which in turn will push up inflation forcing the Fed to hike rates more than it wants to.
Unemployment Rate
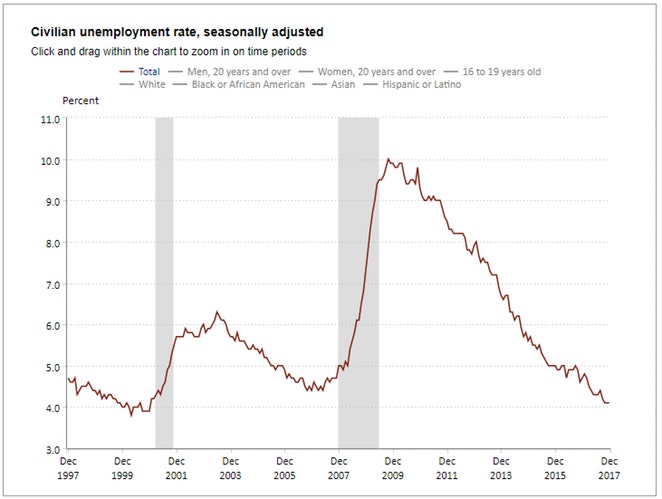
The principle basis behind the tight labor theory is the falling unemployment rate.
The unemployment rate is so distorted that one might wonder why anyone puts any credence into it at all.
Then again, Janet Yellen also believes in the Phillips Curve despite the fact that a Fed Study Shows Phillips Curve Is Useless.
The Phillips Curve theory purports "that inflation and unemployment have a stable and inverse relationship."
Simply put, Phillips Curve proponents believe that falling unemployment leads to higher inflation.
Phillips Curve
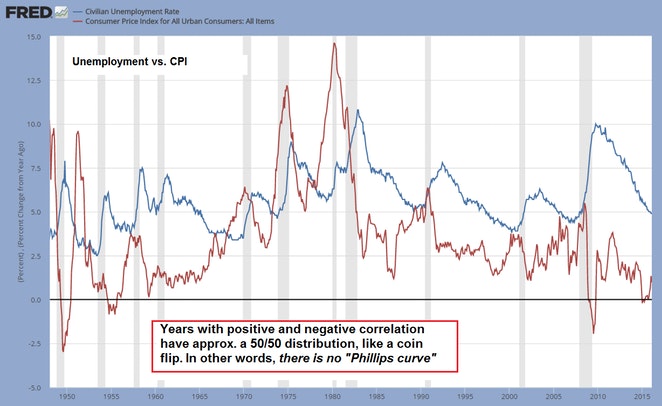
The above chart courtesy of Pater Tenebrarum at the Acting Man blog.
Job Hopping Not
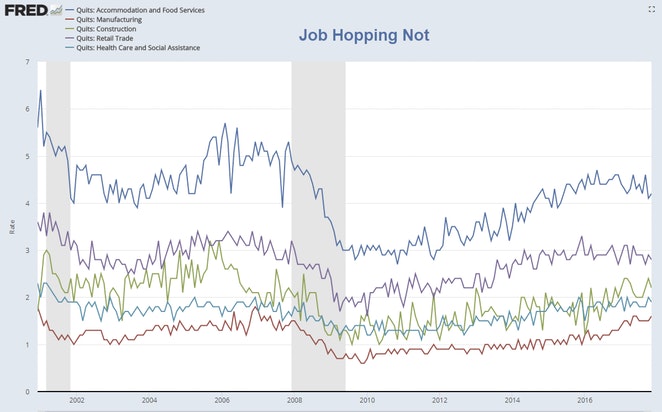
The Wall Street Journal reports A Tight Labor Market Should Prompt Job-Hopping. It’s Not
The Journal article plotted "separations", I plotted "quits" because they are voluntary.
Hopping is not going according to theory, neither is wage growth.
People are holding on to most jobs compared to pre-recession stats, especially food service jobs.
Hourly Wage Growth
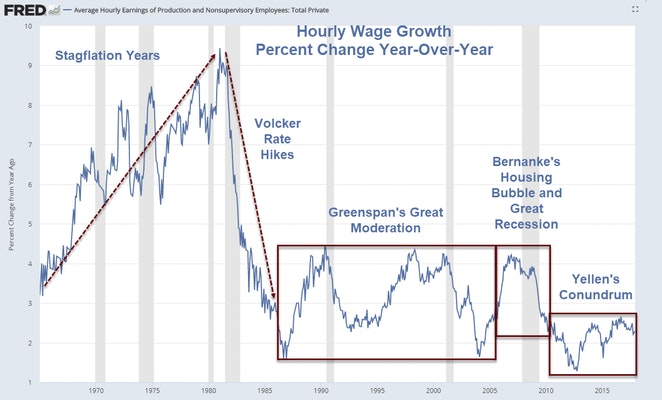
As a Phillips Curve proponent, Yellen believes that wage growth should be picking up. It isn't.
Jobs vs Employment Discrepancy
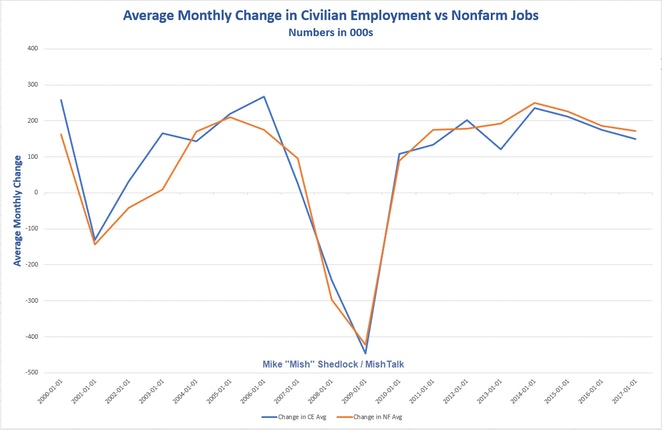
Every month, the BLS posts two sets of numbers. Nonfarm jobs come from the payroll report. Employment and unemployment numbers come from the household survey.
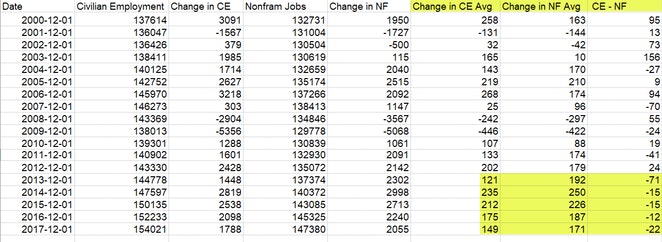
I created the above chart by downloading both sets of numbers then comparing December of 2017 to December in prior years. I used averages for the twelve months.
Starting in 2013 and every year since (5 consecutive years), the change in employment minus the change in nonfarm jobs has been negative.
From 2000 to 2012 (13 years) there were only 4 instances, all nonconsecutive, in which the change in employment minus the change in nonfarm jobs has been negative.
-
On average, for 2013, the BLS reported 71,000 more jobs per month than employment
-
On average, for 2014, the BLS reported 15,000 more jobs per month than employment
-
On average, for 2015, the BLS reported 15,000 more jobs per month than employment
-
On average, for 2016, the BLS reported 12,000 more jobs per month than employment
-
On average, for 2017, the BLS reported 22,000 more jobs per month than employment
I have pointed out this discrepancy before and I believe it is related to Obamacare and the change in the number of hours one has to work to be considered full-time.
The new Obamacare definition of full-time is 30 hours. The BLS definition is 35 hours. It appears as if employers cut back hours and people started working extra jobs as a result.
The problem with that theory is that it does not show up in BLS multiple jobs stats.
Then again, the BLS takes someone working 20 hours at one job and 15 hours at a second job and counts that as one full-time employee.
The Jobs report says two jobs were created.
I strongly suggest there is failure to correctly count multiple jobholders in the employment report.
I am positive there is a failure to weed out duplicate social security numbers in the establishment survey.
Finally, note that year-over-year changes in both jobs and employment peaked in 2014.
Prime Working Age Underemployment
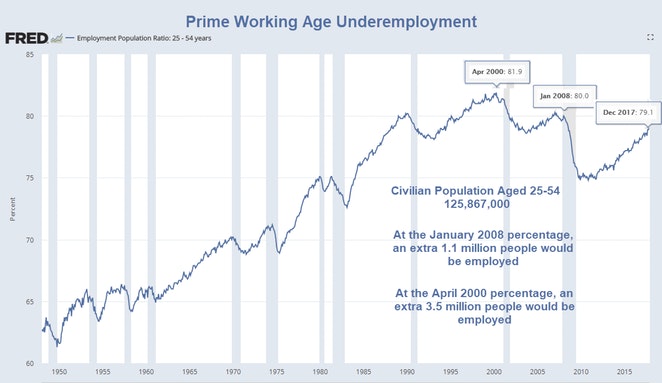
At the employment population ratio in January of 2008, an extra 1.1 million prime age persons, age 25-54, would now be working.
At the April 2000 ratio, an extra 3.5 million prime age persons would be working.
Teen Underemployment
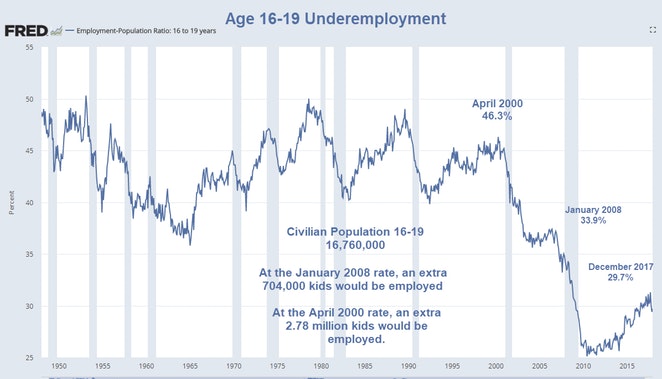
At the employment population ratio in January of 2008, an extra 704,000 teens would now be working.
At the April 2000 ratio, an extra 2.78 million teens would be working.
First to Go, Most to Drop
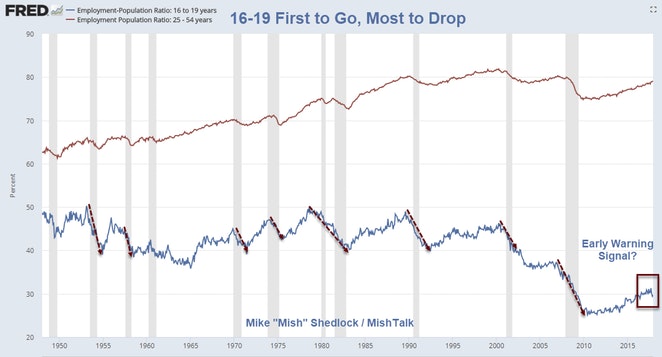
When it comes to letting employees go, or not hiring them in the first place, the 16-19 year olds are the first to go and suffer the biggest employment declines.
Note the possible trend change in 16-19 employment.
Perhaps it's nothing, or perhaps it's related to minimum wage hikes, but perhaps it's an early warning sign.
Overheating Not
The unemployment numbers may suggest one thing, but the preponderance of data suggests another.
Signs of overheating are simply not present.
Author

Mike “Mish” Shedlock's
Sitka Pacific Capital Management,Llc


