The U.S. spending path

Free Money
This article discusses evidence for the causes of hyperinflations and defaults. We put the current U.S. debt situation in a historical context and assesses the probability of a significant shock to the financial system. A default or hyperinflation is very unlikely short-term and 10-year Treasury rates probably drift lower during the next months. Subsequently, the next expansionary cycle will start and probably mark a significant turning point for U.S. Treasuries.
Defaults & Hyperinflations
Peter Bernholz, a Swiss-German economics professor, researched the causes of past hyperinflations. 25 of 29 hyperinflations in his long-term dataset were the result of government budget deficits financed by money creation. External shocks in the post-communist era triggered the remaining four. Historical evidence shows that past hyperinflations were often proceeded by multi-year budget deficits that amounted to roughly 40% of GDP.
(Sources: Anychart.com)
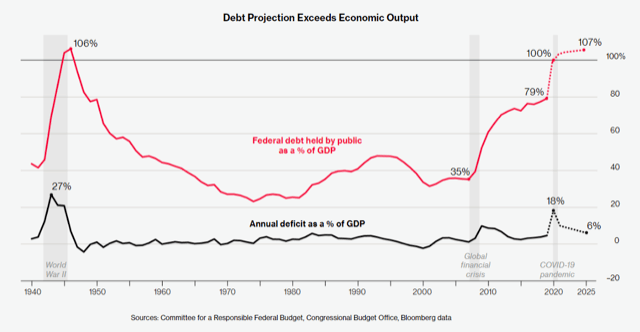
The first chart above shows that the U.S. budget deficit did not amount to double-digit negative figures for multiple years. Nonetheless, 2020 might be different due to COVID-19. Stimulus spending and lower revenues from the recession could trigger a 20%-30% deficit. Total national debt is the other important metric that shows when government spending encountered a head-on collision historically. The U.S. is probably crossing a 100% debt-to-GDP ratio this year. This metric had a historical default probability of about 2.2%.
(Sources: Peter Bernholz, Monetary Regimes and Inflation, History, Economic and Political Relationships; The League of Nations, Mitchell)
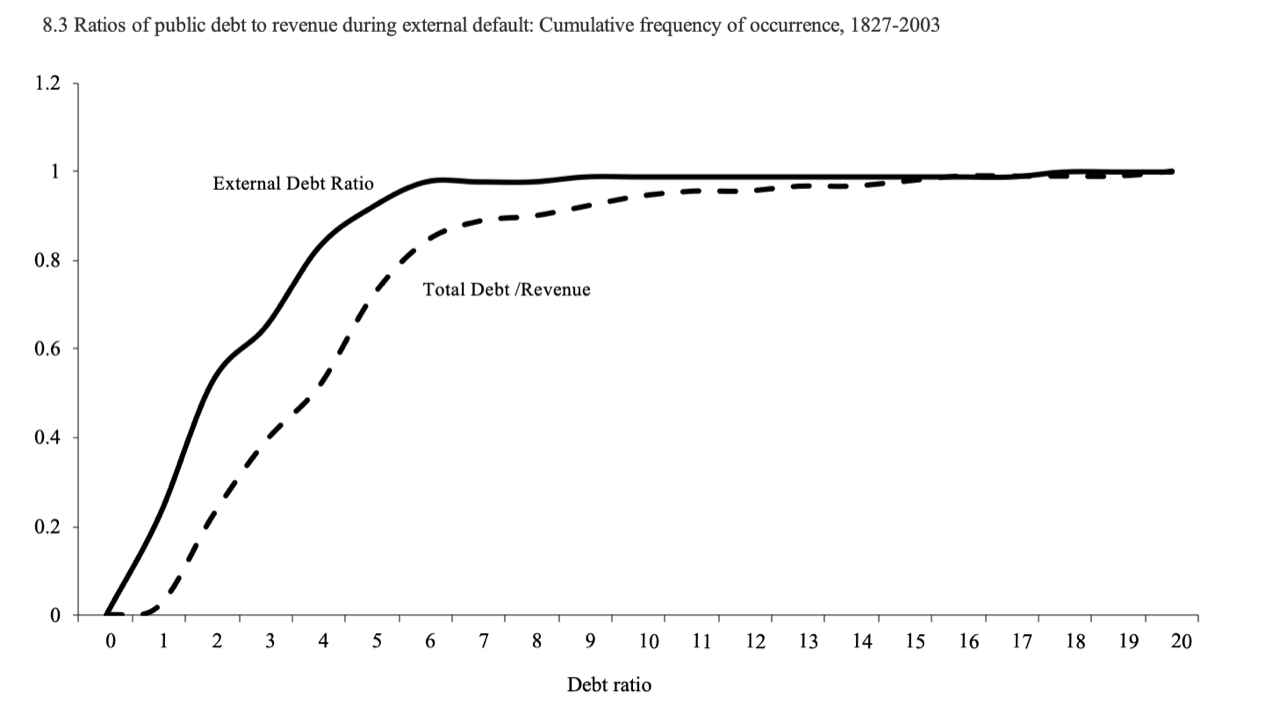
Both metrics, budget deficit and government debt, do not hint to default or hyperinflation in the U.S. near term. Nonetheless, the wildcard is Q.E., which will bring the Fed’s balance sheet to roughly 9 trillion this year. That amounts to another 44% of total GDP. It needs to be added to the big picture and sends a clear message that the U.S. government cannot afford to spend the next decade as it did during the past one. Otherwise, total federal debt enters the 2-3 debt-to-GDP ratio band, which has about 50% odds of a significant shock to the financial system.
To put that into everyday language: The USA is on a mid-term path to either default or hyperinflation unless its spending policy changes significantly. The “free money” environment that allows governments to take debt at no or even negative cost is unsustainable. History shows how similar situations resolved. A turning point might come later this year.
Sovereign yields in developed economies are still within a secular downside trend. Central banks continue buying bonds and keep rates artificially down. 10-year U.S. Treasury yields are likely going lower short-term. It is crucial to understand the time-frame of this outlook, which is short-term only. The next expansionary cycle will start at some point during the upcoming months and fundamentals do not justify long-term rates at multi-century lows around 0%, while the government is on the best track to hit a financial disaster.
Outlook
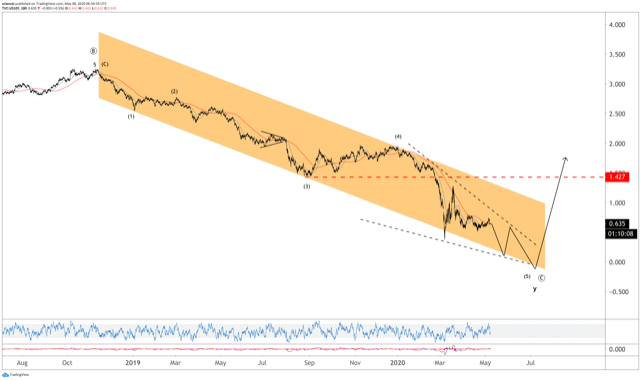
Technically speaking, the critical figure is 1.40% for the 10-year U.S. Treasury yield. Yields are likely to drift lower unless a sustained break above 1.40% occurs. That level is a critical support/resistance and coincides with a breakout above the short-term trend for lower rates.
The bottom line is that it is safe to keep the powder dry in cash and short-term U.S. Treasuries during the next months. Moreover, a long duration position trade might continue to pay off until Autumn. Nonetheless, the bond bull market probably breaths its last breath. Fundamentals will get a grip on rates eventually. Last but not least, it is most likely the perfect moment to start negotiating the refinancing of USD mortgages and fix long-term rates.
Interested in more of our ideas? Check out Scienceinvesting for more details!
Author

Science Investing Team
Science Investing


