The US Dollar Index analysis: Continued oscillation between 93.80-94.60

Fundamental review
The US Dollar rallied on better-than-expected US Retail Sales data. The rise in Retail Sales reflects a strong demand, higher consumer prices and a continued increase in inflationary pressures. Meanwhile, the rise in new confirmed COVID cases in September depressed consumer demand in the tourism and entertainment sectors, causing consumers to shift their spending to the Retail and Foodservice sectors. These factors could further put more pressure on the global inflation environment.
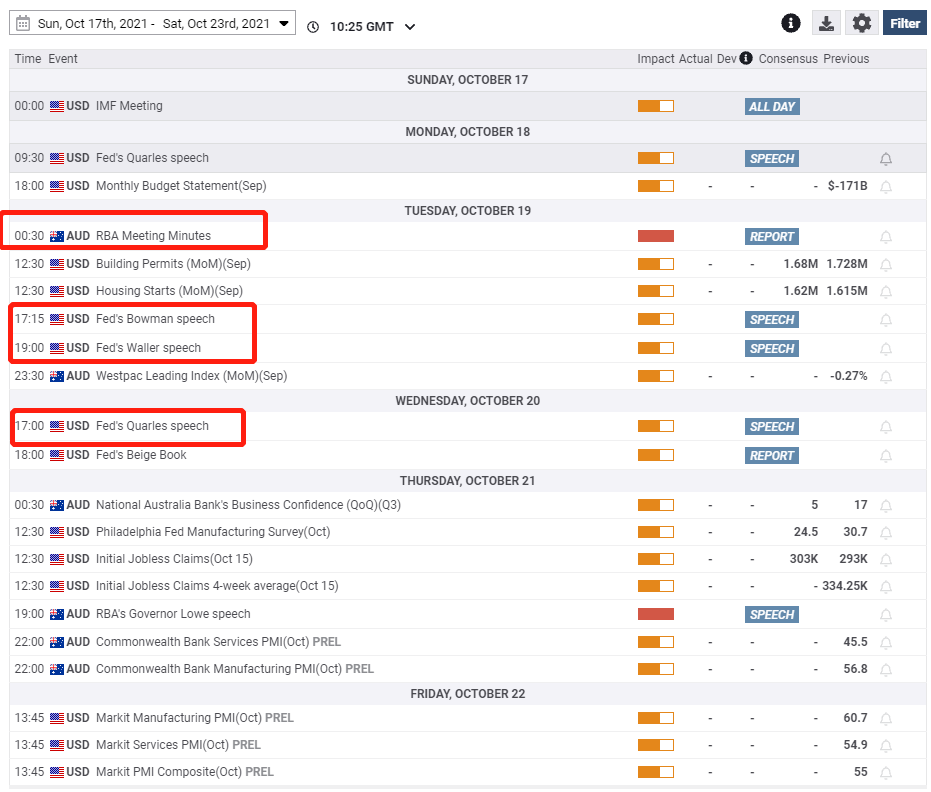
This week, in addition to the RBA Meeting Minutes on Tuesday(AEST), we still need to pay attention to the speeches of the Fed officials.
Technical analysis
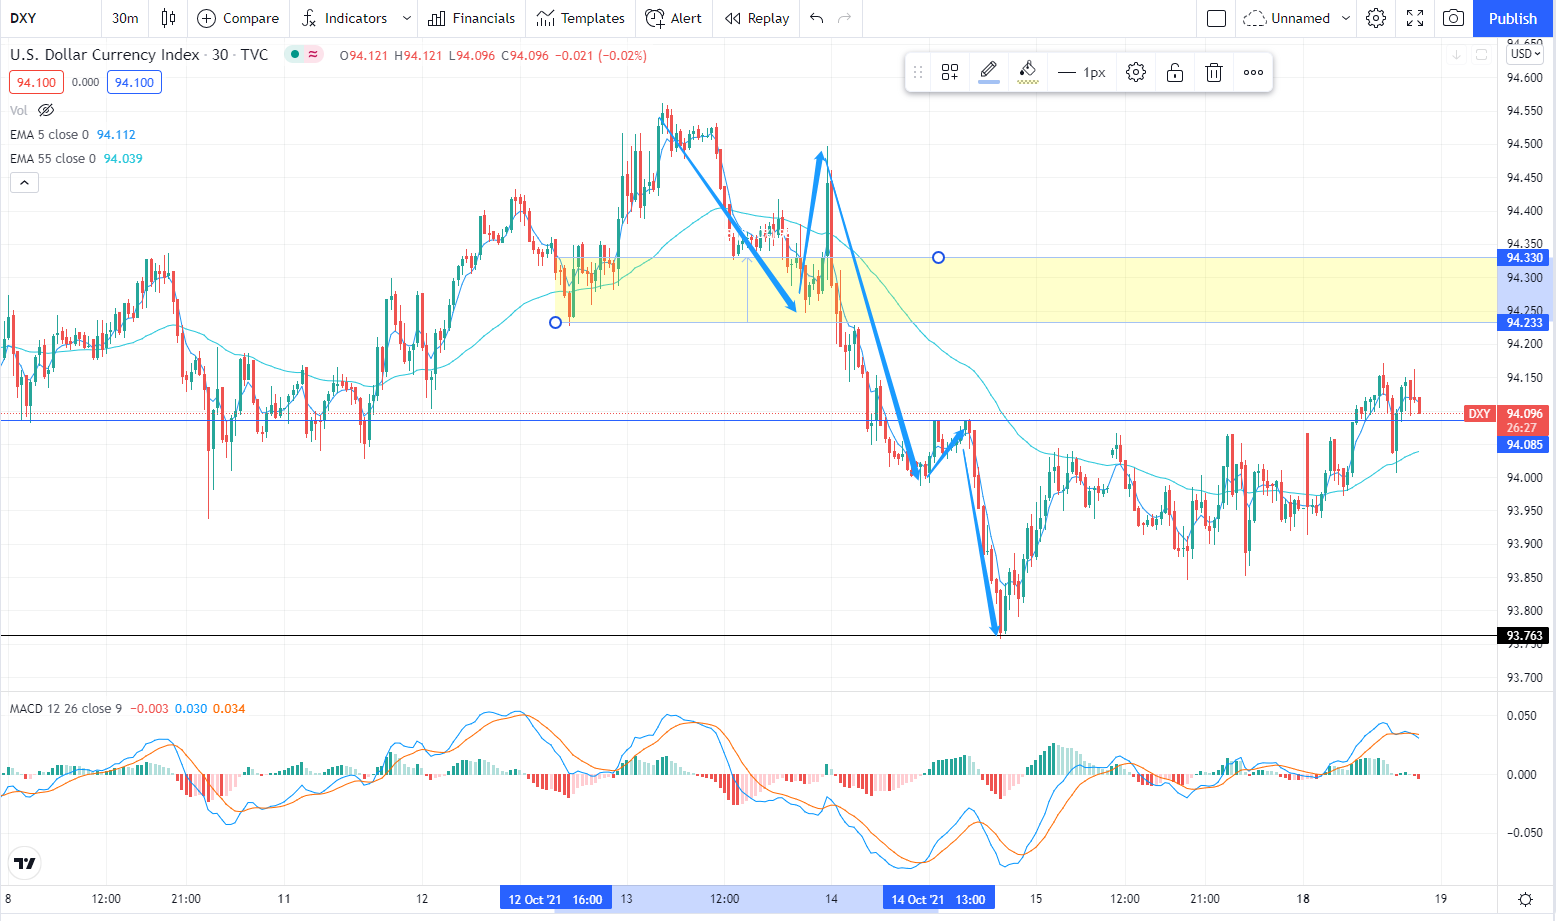
DXY(30 minutes chart)
The dollar has started to stabilize and rebound after a five-wave Elliott decline to around 93.80, and buyers have now managed to push prices past the important resistance level at 94.08. If the price continues on the current trajectory, then the next upside pressure could come from the 94.23-94.33 area. However, once the price is blocked here and resumes its downtrend, then traders should focus on 93.60-93.80, as a deterioration at this support barrier could lead to a price dive, with sellers targeting the 93.35-93.50 support section.
Looking at the 4 hours chart, the dollar is currently in the same situation as last week, it is still oscillating in the 93.80-94.60 price area. Traders need to wait patiently for prices to break out of this range to get a clearer direction.
Author

Brian Wang
Independent Analyst
Based in Melbourne, Brian joined Capital.com in 2022 as a Dealer.


