|

The TLT Longer Term Cycles and Elliott Wave Analysis

Firstly the ETF fund TLT inception date was on July 22, 2002. This instrument seeks to track the investment results of an index composed of or in U.S. Treasury bonds with maturities twenty years or more remaining. There is a lack of data before July 22, 2002. This is established.  This article will focus on the larger uptrend cycle from there which is presumed finished a cycle higher from those lows in wave ((a)) in July 2016. The pullback from that high appeared to be an Elliott wave zig zag structure in three waves into the November 2018 wave ((b)) lows.

The analysis continues below the monthly chart

TLT

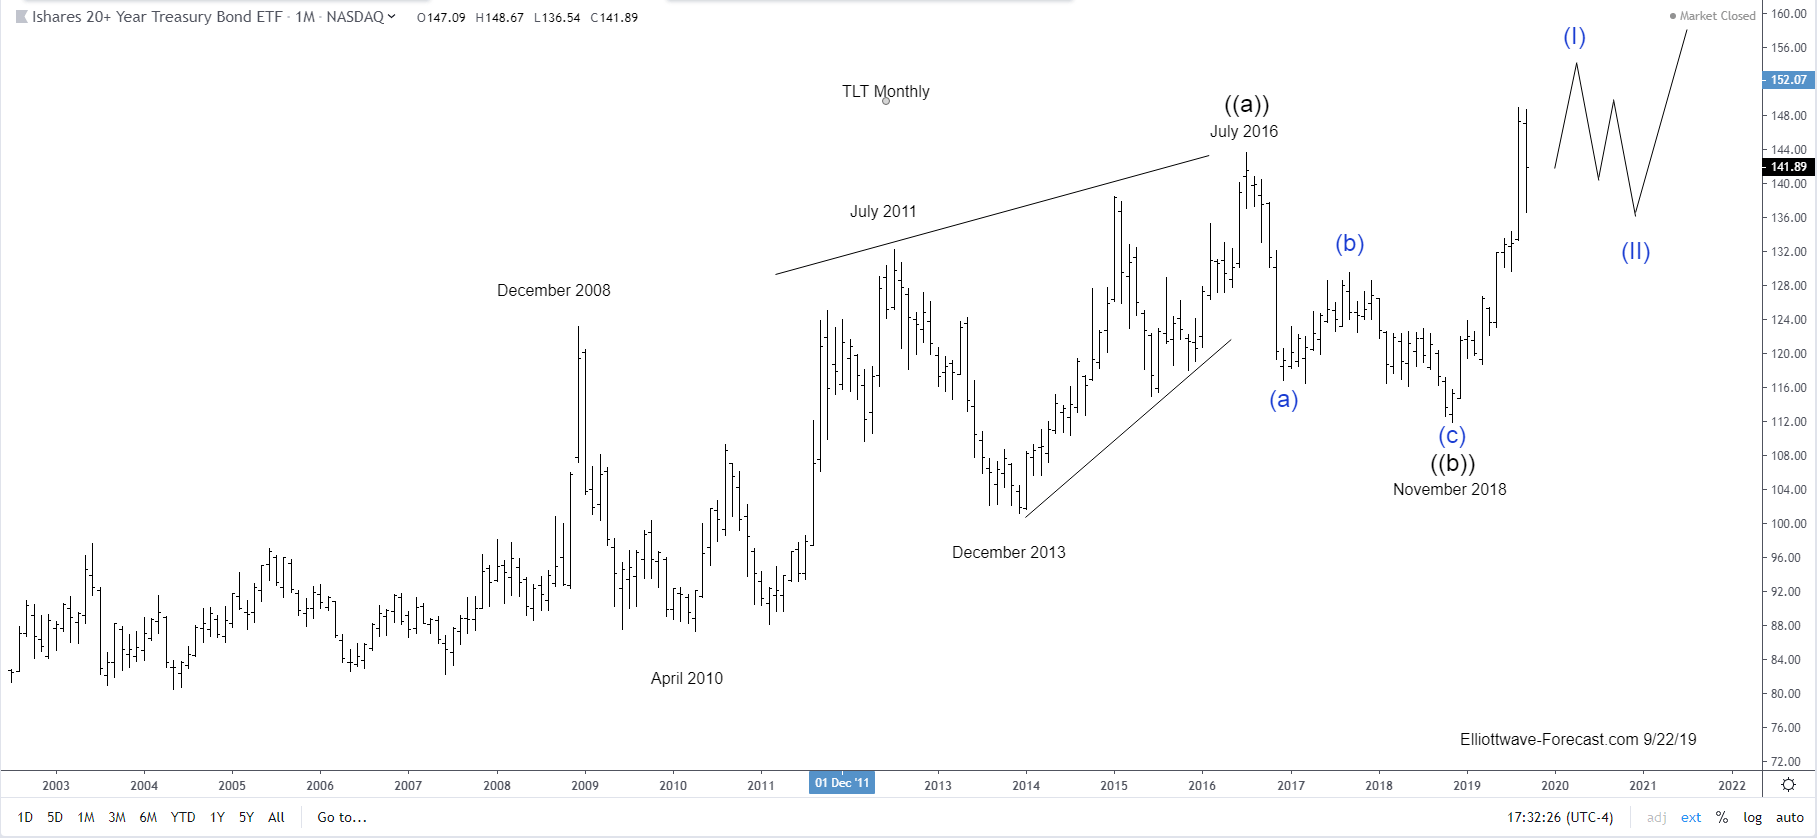
Secondly:  The aforementioned pullback lower in the monthly chart wave ((b)) was strong enough to suggest it was correcting the cycle up from the all time lows.  Thus it ended that cycle. From those November 2018 lows the instrument has made another high above the July 2016 highs creating a bullish sequence. This sequence higher from the November 2018 lows appears to be incomplete. On the weekly chart shown below, Elliott wave corrective sequences are in either three, seven or eleven swings. Impulses are in either five, nine or thirteen swings. It is obvious the three swings lower the July 2016 highs into the October 2018 lows were of three swings.

The analysis continues and concludes below the weekly chart

TLT

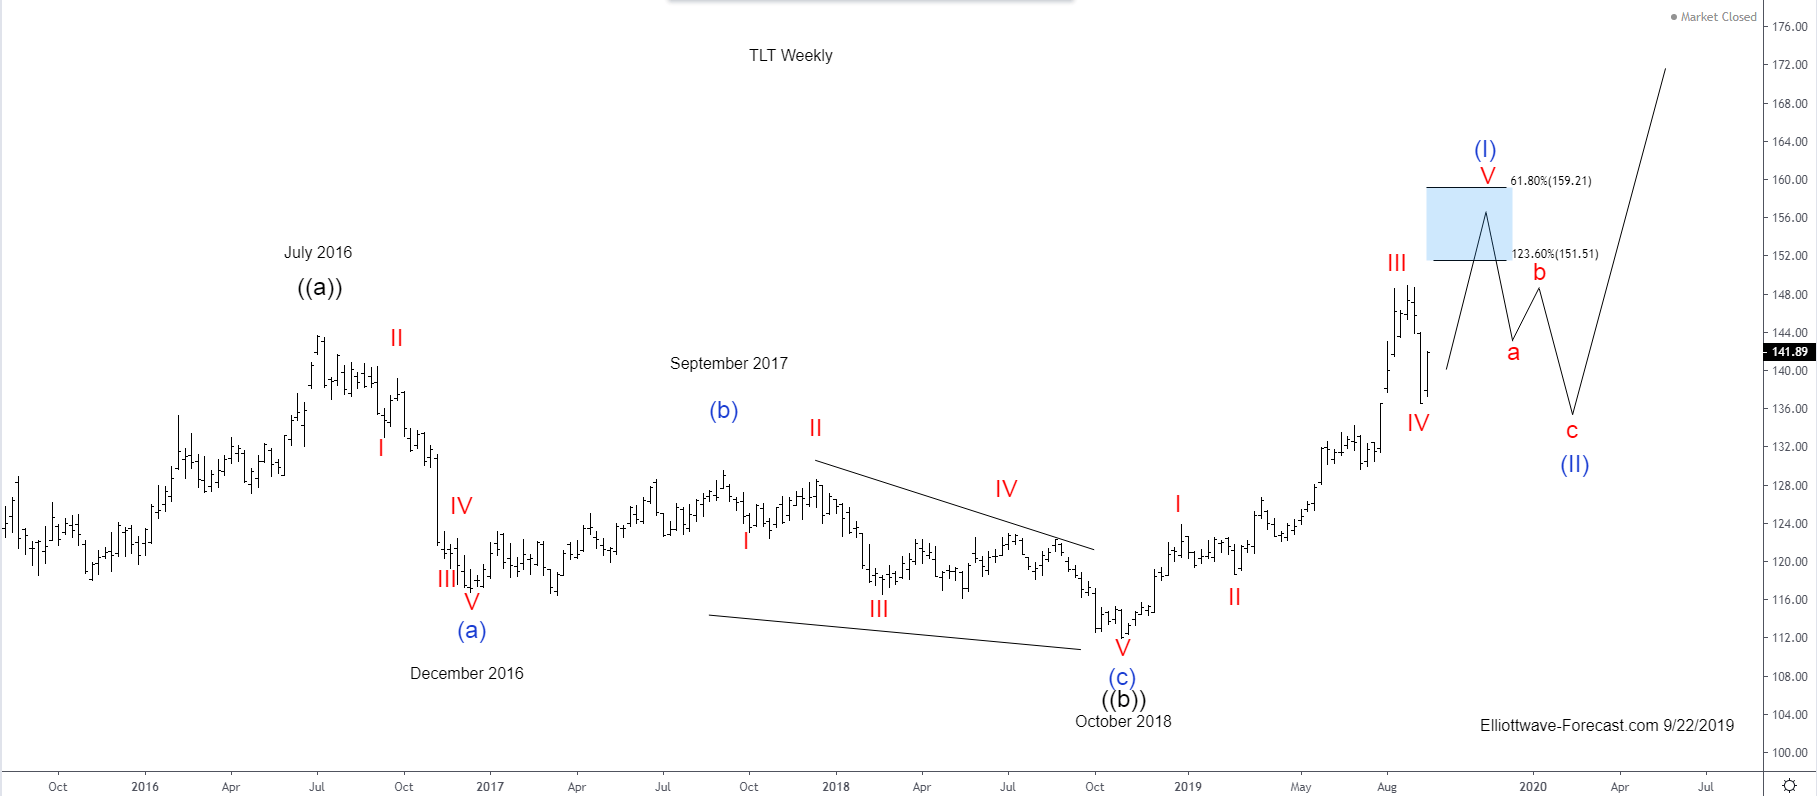
Thirdly and in conclusion the cycle up from the October 2018 lows appears to be an impulse that is incomplete. The pullback to the 136.54 lows on 9/13/19 is favored ended wave IV. This is due to the bounce from there being strong enough to suggest it ended the cycle lower from the wave III highs which were of three swings in a flat. The article here is how to get the proposed fifth wave target area.  While above there it can see the 151.51-159.21 area in wave V before a larger pullback develops to correct the cycle up from the October 2018 lows.

Author

Elliott Wave Forecast Team

Elliott Wave Forecast Team

ElliottWave-Forecast.com

More from Elliott Wave Forecast Team
Share:

Editor's Picks

EUR/USD extends its optimism past 1.1900

EUR/USD retains a firm underlying bid, surpassing the 1.1900 mark as the NA session draws to a close on Monday. The pair’s persistent uptrend comes as the US Dollar remains on the defensive, with traders staying cautious ahead of upcoming US NFP prints and CPI data.
 

GBP/USD hits three-day peaks, targets 1.3700

GBP/USD is clocking decent gains at the start of the week, advancing to three-day highs near 1.3670 and building on Friday’s solid performance. The better tone in the British Pound comes on the back of the intense sekk-off in the Greenback and despite re-emerging signs of a fresh government crisis in the UK.

Gold picks up pace, retargets $5,100

Gold gathers fresh steam, challenging daily highs en route to the $5,100 mark per troy ounce in the latter part of Monday’s session. The precious metal finds support from fresh signs of continued buying by the PBoC, while expectations that the Fed could lean more dovish also collaborate with the uptick.

XRP struggles around $1.40 despite institutional inflows

Ripple (XRP) is extending its intraday decline to around $1.40 at the time of writing on Monday amid growing pressure from the retail market and risk-off sentiment that continues to keep investors on the sidelines.

Japanese PM Takaichi nabs unprecedented victory – US data eyed this week

I do not think I would be exaggerating to say that Japanese Prime Minister Sanae Takaichi’s snap general election gamble paid off over the weekend – and then some. This secured the Liberal Democratic Party (LDP) an unprecedented mandate just three months into her tenure.

Ripple exposed to volatility amid low retail interest, modest fund inflows

Ripple (XRP) is extending its intraday decline to around $1.40 at the time of writing on Monday amid growing pressure from the retail market and risk-off sentiment that continues to keep investors on the sidelines.