The Taxman Cometh

US Dollar: Jun '23 USD is Up at 101.820.
Energies: May '23 Crude is Down at 79.45.
Financials: The Jun '23 30 Year T-Bond is Down 21 tick and trading at 129.12.
Indices: The Jun '23 S&P 500 Emini ES contract is 100 ticks Lower and trading at 4155.00.
Gold: The Jun'23 Gold contract is trading Down at 1987.60. Gold is 323 ticks Lower than its close.
Initial conclusion
This is not a correlated market. The USD is Up, and Crude is Down which is normal, and the 30 Year T-Bond is trading Lower. The Financials should always correlate with the US dollar such that if the dollar is Higher, then the bonds should follow and vice-versa. The S&P is Lower, and Crude is trading Lower which is not correlated. Gold is trading Lower which is correlated with the US dollar trading Up. I tend to believe that Gold has an inverse relationship with the US Dollar as when the US Dollar is down, Gold tends to rise in value and vice-versa. Think of it as a seesaw, when one is up the other should be down. I point this out to you to make you aware that when we don't have a correlated market, it means something is wrong. As traders you need to be aware of this and proceed with your eyes wide open. At the present time all of Asia is trading Lower with the exception of the Singapore exchange which is Higher. Currently all of Europe is trading Lower. .
Possible challenges to traders today
-
Crude Oil Inventories are out at 10:30 AM EST. This is Major.
-
Beige Book is out at 2 PM EST. This is Major.
-
FOMC Member Goolsbee Speaks at 5:30 PM EST. This is not Major.
Treasuries
Traders, please note that we've changed the Bond instrument from the 30 year (ZB) to the 10 year (ZN). They work exactly the same.
We've elected to switch gears a bit and show correlation between the 10-year bond (ZN) and the S&P futures contract. The S&P contract is the Standard and Poor's, and the purpose is to show reverse correlation between the two instruments. Remember it's likened to a seesaw, when up goes up the other should go down and vice versa.
Yesterday the ZN migrated Higher at around 9:20 AM EST but at the same time the S&P hit a High. If you look at the charts below the ZN gave a signal at around 9:20 AM and the ZN continued its Upward trend. Look at the charts below and you'll see a pattern for both assets. S&P hit a High at around 9:20 AM and migrated Lower. These charts represent the newest version of MultiCharts and I've changed the timeframe to a 15-minute chart to display better. This represented a Long opportunity on the 10-year note, as a trader you could have netted about 20 ticks per contract on this trade. Each tick is worth $15.625. Please note: the front month for the ZN is now Jun '23. The S&P contract is also Jun' 23. I've changed the format to filled Candlesticks (not hollow) such that it may be more apparent and visible.
Charts courtesy of MultiCharts built on an AMP platform
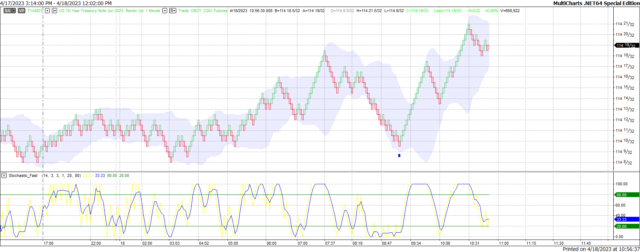
ZN - Jun 2023 - 4/18/23
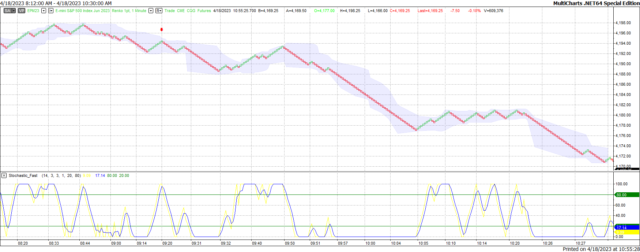
S&P - Jun 2023 - 4/18/23
Bias
Yesterday we gave the markets an Upside bias as both the USD and the Bonds were trading Lower, and this usually represents an Upside Day. The markets had other ideas as the markets closed Mixed. The Dow was Lower by 11 points, the S&P Higher by 4 but the Nasdaq Lower by 4. Today we aren't dealing with a correlated market and our bias is Neutral.
Could this change? Of Course. Remember anything can happen in a volatile market.
Commentary
Yesterday we suggested an Upside Day. However, we had two major economic reports, both out at 10 AM; one being Building Permits and the other Housing Starts. These are both major and proven market movers. Unfortunately, neither one of these reports beat prior results and the markets traded Mixed after this. Today we have Crude Oil Inventories (which is usual for a Wednesday) and the Fed Beige Book. Will this be enough to move market direction to the Upside? Only time will tell...
Author

Nick Mastrandrea
Market Tea Leaves


