The Taxman Cometh

Good Morning Traders,
As of this writing 3:50 AM EST, here’s what we see:
US Dollar: Jun. USD is Down at 88.975.
Energies: May '18 Crude is Up at 66.51.
Financials: The June 30 year bond is Down 7 ticks and trading at 145.08.
Indices: The June S&P 500 emini ES contract is 36 ticks Higher and trading at 2690.75.
Gold: The June gold contract is trading Down at 1348.20. Gold is 25 ticks Lower than its close.
Initial Conclusion
This is not a correlated market. The dollar is Down- and Crude is Up+ which is normal and the 30 year Bond is trading Lower. The Financials should always correlate with the US dollar such that if the dollar is lower then bonds should follow and vice-versa. The S&P is Higher+ and Crude is trading Higher+ which is not correlated. Gold is trading Down- which is not correlated with the US dollar trading Down-. I tend to believe that Gold has an inverse relationship with the US Dollar as when the US Dollar is down, Gold tends to rise in value and vice-versa. Think of it as a seesaw, when one is up the other should be down. I point this out to you to make you aware that when we don't have a correlated market, it means something is wrong. As traders you need to be aware of this and proceed with your eyes wide open.
At this hour all of Asia is trading mainly Lower with the exception of the Nikkei and Singapore exchanges which are Higher. All of Europe is trading Higher with the exception of the London exchange which is Lower at this time.
Possible Challenges To Traders Today
-
Building Permits are out at 8:30 AM EST. This is major.
-
Housing Starts are out at 8:30 AM EST. This is major.
-
Capacity Utilization Rate is out at 9:15 AM EST. This is major.
-
Industrial Production is out at 9:15 AM EST. This is major.
-
FOMC Member Williams Speaks at 9:15 AM EST. Major.
-
FOMC Member Quarles Speaks at 10 AM. This is major.
-
FOMC Member Bostic Speaks at 5:40 PM EST. This is major.
Treasuries
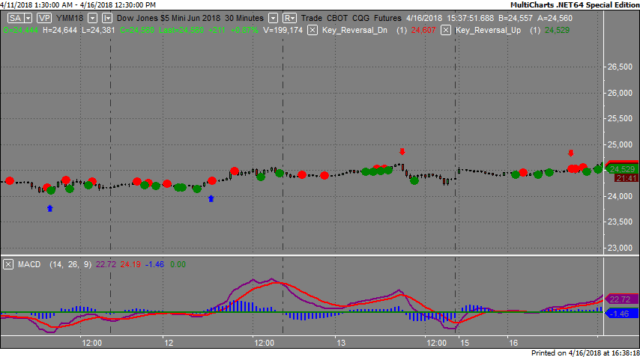
We've elected to switch gears a bit and show correlation between the 30 year bond (ZB) and The YM futures contract. The YM contract is the DJIA and the purpose is to show reverse correlation between the two instruments. Remember it's liken to a seesaw, when up goes up the other should go down and vice versa.
On Friday the ZB made it's move at around 8 AM EST. The ZB hit a Low at around that time and the YM hit a High. If you look at the charts below ZB gave a signal at around 8 AM EST and the YM was moving Lower at the same time. Look at the charts below and you'll see a pattern for both assets. ZB hit a Low at around 8 AM and the YM hit a High. These charts represent the newest version of MultiCharts and I've changed the timeframe to a 30 minute chart to display better. This represented a shorting opportunity on the 30 year bond, as a trader you could have netted about 20 plus ticks per contract on this trade. Each tick is worth $31.25.
Charts Courtesy of MultiCharts built on an AMP platform
-636595595239530132.png)
Bias
Yesterday we gave the markets an Upside bias as all the instruments we track were trading Lower and that's a good indication of an Upside day. The markets didn't disappoint as the Dow rose by 213 points and the other indices gained ground as well. Today we aren't dealing with a correlated market however our bias is to the Upside.
Could this change? Of Course. Remember anything can happen in a volatile market.
Commentary
Yesterday morning all the instruments we track for Market Correlation purposes were pointed Lower yet the indices themselves pointed to the Upside and that is usually a good indication of an Upside day. The markets didn't disappoint and all major indices rose in unison. Today is Tax Day in the United States. We were given somewhat of a reprieve as Monday was officially Patriots Day in the US (Thank you State of Mass). Patriots Day is the Battle of Lexington and Concord and is the start of the American Revolution. This was started by the State of Mass is still celebrated as a state holiday. In our humble it should be a national holiday but then again the IRS did give an extra to file our tax returns....
Author

Nick Mastrandrea
Market Tea Leaves


