Good Morning Traders,

As of this writing 4 AM EST, here’s what we see:

US Dollar: Jun. USD is Down at 100.135.
Energies:
May Crude is Down at 52.92.
Financials:
The June 30 year bond is Up 14 ticks and trading at 153.29.
Indices:
The June S&P 500 emini ES contract is 17 ticks Lower and trading at 2341.00.
Gold: The April gold contract is trading Down at 1286.80. Gold is 51 ticks Lower than its close.

Initial Conclusion

This is not a correlated market. The dollar is Down- and crude is Down- which is not normal but the 30 year bond is trading Higher. The Financials should always correlate with the US dollar such that if the dollar is lower then bonds should follow and vice-versa. The indices are Down- and Crude is trading Down- which is not correlated. Gold is trading Down- which is not correlated with the US dollar trading Down-. I tend to believe that Gold has an inverse relationship with the US Dollar as when the US Dollar is down, Gold tends to rise in value and vice-versa. Think of it as a seesaw, when one is up the other should be down. I point this out to you to make you aware that when we don’t have a correlated market, it means something is wrong. As traders you need to be aware of this and proceed with your eyes wide open.

At this hour Asia is trading mainly Lower with the exception of the Nikkei exchange which are trading Higher. As of this writing all of Europe is trading Lower.

Possible Challenges To Traders Today

– Building Permits are out at 8:30 AM EST. This is major.

– Housing Starts is out at 8:30 AM EST. This is major.

– Capacity Utilization Rate is out at 9:15 AM EST. This is major.

– Industrial Production m/m is out at 9:15 AM EST. This is major.

Treasuries

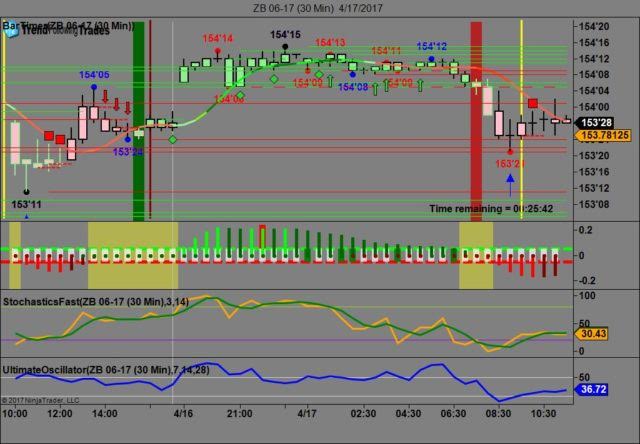
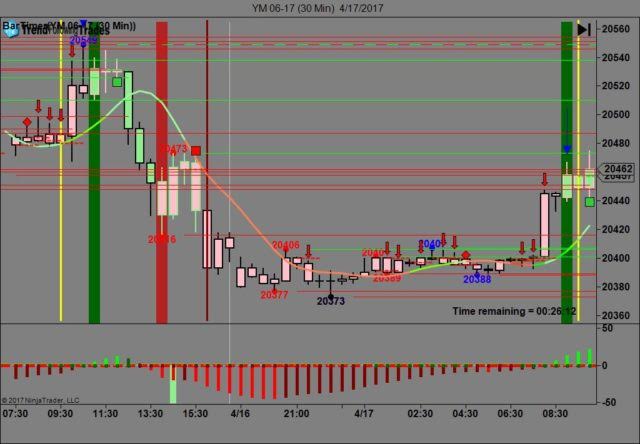
We’ve elected to switch gears a bit and show correlation between the 30 year bond (ZB) and The YM futures contract. The YM contract is the DJIA and the purpose is to show reverse correlation between the two instruments. Remember it’s liken to a seesaw, when up goes up the other should go down and vice versa.

Last Thursday the ZB made it’s move at around 9 AM after the Empire State Manufacturing numbers came out. The ZB hit a low at around that time and the YM hit a high. If you look at the charts below ZB gave a signal at around 9 AM and the YM was moving lower at the same time. Look at the charts below and you’ll see a pattern for both assets. ZB hit a low at around 9 AM and the YM hit a high. These charts represent the newest version of Trend Following Trades and I’ve changed the timeframe to a 30 minute chart to display better. This represented a long opportunity on the 30 year bond, as a trader you could have netted about 12 plus ticks per contract on this trade. Each tick is worth $31.25. We added a Donchian Channel to the charts to show the signals more clearly.

Charts Courtesy of Trend Following Trades built on a NinjaTrader platform.

Tea

Tea

Bias

Yesterday we gave the markets a downside bias as both the Bonds and Gold were trading higher and this usually represents a downside bias. The markets however had other ideas as the Dow gained 184 points and the other indices gained ground as well. Today we aren’t dealing with a correlated market and our bias is neutral.

Could this change? Of Course. Remember anything can happen in a volatile market.

Commentary

So yesterday was the first day back after a long holiday weekend and what happened? Instead of going lower the markets rose. Why? It isn’t unusual that after a lengthy holiday weekend the markets rise as there is pent up demand especially since Europe was closed for Easter Monday. Are we going into the scenario where up day up and the next day down? Only time will tell…

Trading performance displayed herein is hypothetical. The following Commodity Futures Trading Commission (CFTC) disclaimer should be noted.

Hypothetical performance results have many inherent limitations, some of which are described below. No representation is being made that any account will or is likely to achieve profits or losses similar to those shown.

In fact, there are frequently sharp differences between hypothetical performance results and the actual results subsequently achieved by any particular trading program. One of the limitations of hypothetical performance trading results is that they are generally prepared with the benefit of hindsight.

In addition, hypothetical trading does not involve financial risk, and no hypothetical trading record can completely account for the impact of financial risk in actual trading. For example, the ability to withstand losses or to adhere to a particular trading program in spite of trading losses are material points which can also adversely affect actual trading results.

There are numerous other factors related to the markets in general or to the implementation of any specific trading program which cannot be fully accounted for in the preparation of hypothetical performance results and all of which can adversely affect actual trading results.

Trading in the commodities markets involves substantial risk and YOU CAN LOSE A LOT OF MONEY, and thus is not appropriate for everyone. You should carefully consider your financial condition before trading in these markets, and only risk capital should be used.

In addition, these markets are often liquid, making it difficult to execute orders at desired prices. Also, during periods of extreme volatility, trading in these markets may be halted due to so-called “circuit breakers” put in place by the CME to alleviate such volatility. In the event of a trading halt, it may be difficult or impossible to exit a losing position.

Recommended Content


Recommended Content

Editors’ Picks

GBP/USD slides to its lowest level since November, eyes 1.2400 ahead of UK jobs data

GBP/USD slides to its lowest level since November, eyes 1.2400 ahead of UK jobs data

GBP/USD drifts lower for the third straight day on Tuesday and drops to its lowest level since November 17 during the Asian session. Spot prices trade around the 1.2420 region as traders now look to the UK monthly employment details for a fresh impetus.

GBP/USD News

EUR/USD steadies above 1.0600, awaits German ZEW and Powell speech

EUR/USD steadies above 1.0600, awaits German ZEW and Powell speech

EUR/USD is holding above 1.0600 in the European morning on Tuesday, having hit fresh five-month lows. The pair draws support from sluggish US Treasury bond yields but the rebound appears capped amid a stronger US Dollar and risk-aversion. Germany's ZEW survey and Powell awaited. 

EUR/USD News

Gold price holds steady below $2,400 mark, bullish potential seems intact

Gold price holds steady below $2,400 mark, bullish potential seems intact

Gold price oscillates in a narrow band on Tuesday and remains close to the all-time peak. The worsening Middle East crisis weighs on investors’ sentiment and benefits the metal. Reduced Fed rate cut bets lift the USD to a fresh YTD top and cap gains for the XAU/USD.

Gold News

SOL primed for a breakout as it completes a rounding bottom pattern

SOL primed for a breakout as it completes a rounding bottom pattern

Solana price has conformed to the broader market crash, following in the steps of Bitcoin price that remains in the red below the $65,000 threshold. For SOL, however, the sensational altcoin could have a big move in store.

Read more

Key economic and earnings releases to watch

Key economic and earnings releases to watch

The market’s focus may be on geopolitical issues at the start of this week, but there is a large amount of economic data and more earnings releases to digest in the coming days. 

Read more

Majors

Cryptocurrencies

Signatures