The Tax Man Cometh
US Dollar: June USD is Down at 96.465.
Energies: May '19 Crude is Down at 63.32.
Financials: The Jun 30 year bond is Down 1 tick and trading at 146.27.
Indices: The June S&P 500 emini ES contract is 4 ticks Higher and trading at 2913.50.
Gold: The June Gold contract is trading Down at 1288.70 Gold is 65 ticks Lower than its close.
Initial Conclusion
This is not a correlated market. The dollar is Down- and Crude is Down- which is not normal and the 30 year Bond is trading Lower. The Financials should always correlate with the US dollar such that if the dollar is lower then bonds should follow and vice-versa. The S&P is Higher and Crude is trading Lower which is correlated. Gold is trading Higher which is correlated with the US dollar trading Down. I tend to believe that Gold has an inverse relationship with the US Dollar as when the US Dollar is down, Gold tends to rise in value and vice-versa. Think of it as a seesaw, when one is up the other should be down. I point this out to you to make you aware that when we don't have a correlated market, it means something is wrong. As traders you need to be aware of this and proceed with your eyes wide open.
At this hour Asia is trading Mixed with half the exchanges Higher and other half Lower. Currently all of Europe is trading Higher.
Possible Challenges To Traders Today
-
Empire State Manufacturing Index is out at 8:30 AM EST. This is major.
-
FOMC Member Evans Speaks at 8:30 AM EST. This is major.
-
FOMC Member Evans Speaks at 1 PM EST. This is major.
-
TIC Long-Term Purchases is out at 4 PM EST. This is not major.
Treasuries
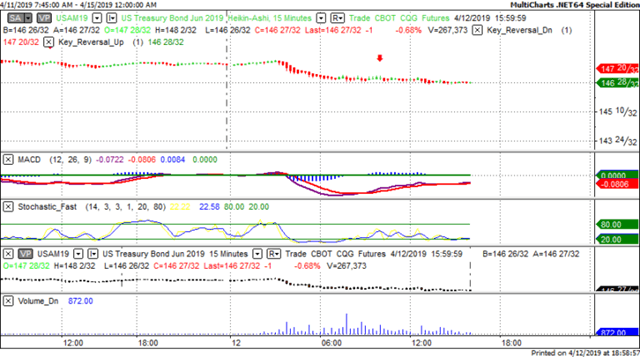
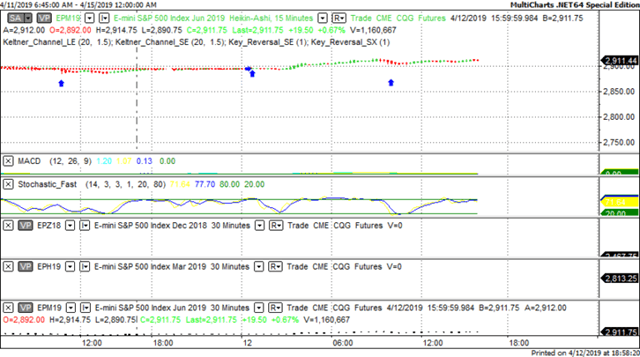
We've elected to switch gears a bit and show correlation between the 30 year bond (ZB) and The YM futures contract. The YM contract is the DJIA and the purpose is to show reverse correlation between the two instruments. Remember it's liken to a seesaw, when up goes up the other should go down and vice versa.
On Friday the ZB made a major move at around 10 AM EST. The ZB hit a High at around that time and the YM hit a Low. If you look at the charts below ZB gave a signal at around 10 AM EST and the YM was moving Higher at the same time. Look at the charts below and you'll see a pattern for both assets. ZB hit a High at around 10 AM and the YM was moving Higher at the same time. These charts represent the newest version of MultiCharts and I've changed the timeframe to a 15 minute chart to display better. This represented a Long opportunity on the 30 year bond, as a trader you could have netted about a dozen ticks per contract on this trade. Each tick is worth $31.25. Please note: the front month for the ZB contract is now June, 2019
Charts Courtesy of MultiCharts built on an AMP platform.
Bias
On Friday we gave the markets a Neutral bias as we didn't see much in the way of direction Friday morning. The Dow gained 269 points and the other indices gained ground as well. Todawy we aren't dealing with a correlated market and our bias is to the Upside.
Could this change? Of Course. Remember anything can happen in a volatile market.
Commentary
We didn't see much in the way of direction Friday morning which led us to declare a Neutral bias. The markets closed higher but the reason wasn't formal economic news per se. It seems that the US and China are very close to sealing a deal regarding trade and trade goods and services which we believe drove the markets higher on Friday. Today is tax day in the U.S. and if you owe the US government taxes today is the day of reckoning. However what no one mentions is if the US government owes you money then you can file whenever you like or if you neither owe nor are entitled to a refund then likewise you can file anytime after April 15th.
Author

Nick Mastrandrea
Market Tea Leaves


