The Tariff Trade Strikes Again

US Dollar: Jun. USD is Down at 89.310.
Energies: May '18 Crude is Up at 65.02.
Financials: The June 30 year bond is Up 6 ticks and trading at 144.30.
Indices: The June S&P 500 emini ES contract is 12 ticks Lower and trading at 2640.25.
Gold: The April gold contract is trading Up at 1340.80. Gold is 134 ticks Higher than its close.
Initial Conclusion
This is not a correlated market. The dollar is Down- and Crude is Up+ which is normal but the 30 year Bond is trading Higher. The Financials should always correlate with the US dollar such that if the dollar is lower then bonds should follow and vice-versa. The S&P is Lower and Crude is trading Up+ which is correlated. Gold is trading Up+ which is correlated with the US dollar trading Down-. I tend to believe that Gold has an inverse relationship with the US Dollar as when the US Dollar is down, Gold tends to rise in value and vice-versa. Think of it as a seesaw, when one is up the other should be down. I point this out to you to make you aware that when we don't have a correlated market, it means something is wrong. As traders you need to be aware of this and proceed with your eyes wide open.
At this hour all of Asia is trading mainly Lower. Currently all of Europe is trading Lower as well.
Possible Challenges To Traders Today
-
FOMC Member Bostic Speaks at 8:10 AM EST. This is major.
-
Core Durable Goods Orders is out at 8:30 AM EST. Major.
-
Durable Goods Orders m/m is out at 8:30 AM EST. Major
-
New Home Sales is out at 10 AM EST. This is major.
Treasuries
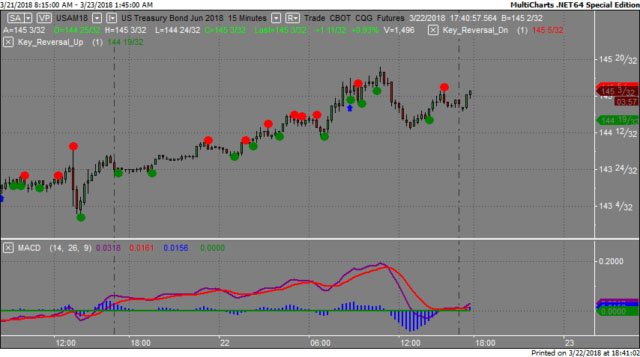
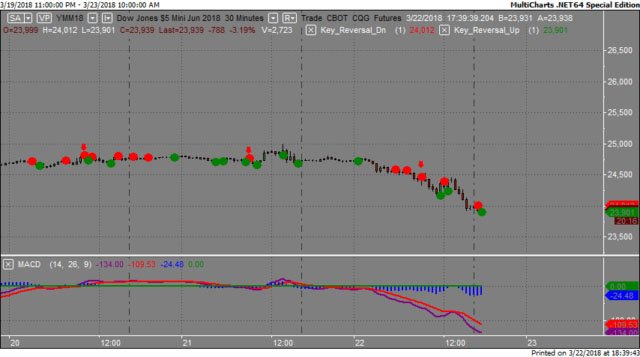
We've elected to switch gears a bit and show correlation between the 30 year bond (ZB) and The YM futures contract. The YM contract is the DJIA and the purpose is to show reverse correlation between the two instruments. Remember it's liken to a seesaw, when up goes up the other should go down and vice versa.
Yesterday the ZB made it's move at around 9 AM. The ZB hit a Low at around that time and the YM hit a High. If you look at the charts below ZB gave a signal at around 9 AM EST and the YM was moving Lower at the same time. Look at the charts below and you'll see a pattern for both assets. ZB hit a Low at around 9 AM and the YM hit a High. These charts represent the newest version of MultiCharts and I've changed the timeframe to a 30 minute chart to display better. This represented a Long opportunity on the 30 year bond, as a trader you could have netted about 15 ticks per contract on this trade. Each tick is worth $31.25.
Charts Courtesy of MultiCharts built on an AMP platform.
Bias
Yesterday we gave the markets a Downside bias and the markets more than exceeded expectation. The Dow dropped 725 points and the other indices lost ground as well. Today we aren't dealing with a correlated market and our bias is to the Downside.
Could this change? Of Course. Remember anything can happen in a volatile market.
Commentary
Yesterday we predicted a Downside day and the markets didn't disappoint as the Dow dropped 725 points and the other indices dropped as well. The major reason why this occurred was Trump levying tariffs on 60 billion dollars worth of Chinese imports. The market don't like this because it means higher prices for any item imported from China and let's face it most of the products we buy today are made in China. We said a couple of weeks ago when the Tariff Trade first came about that it would lead to higher prices and now it's happening.
Author

Nick Mastrandrea
Market Tea Leaves


