The Sunspot Predicting a Mega Crash

I was looking at some cycle work from J. M. Hurst, and there were related articles on how sunspot cycles affect very short-term movements in stocks – not just the 8-14, or near 10-year average cycles in booms and busts. I will be looking more into that.
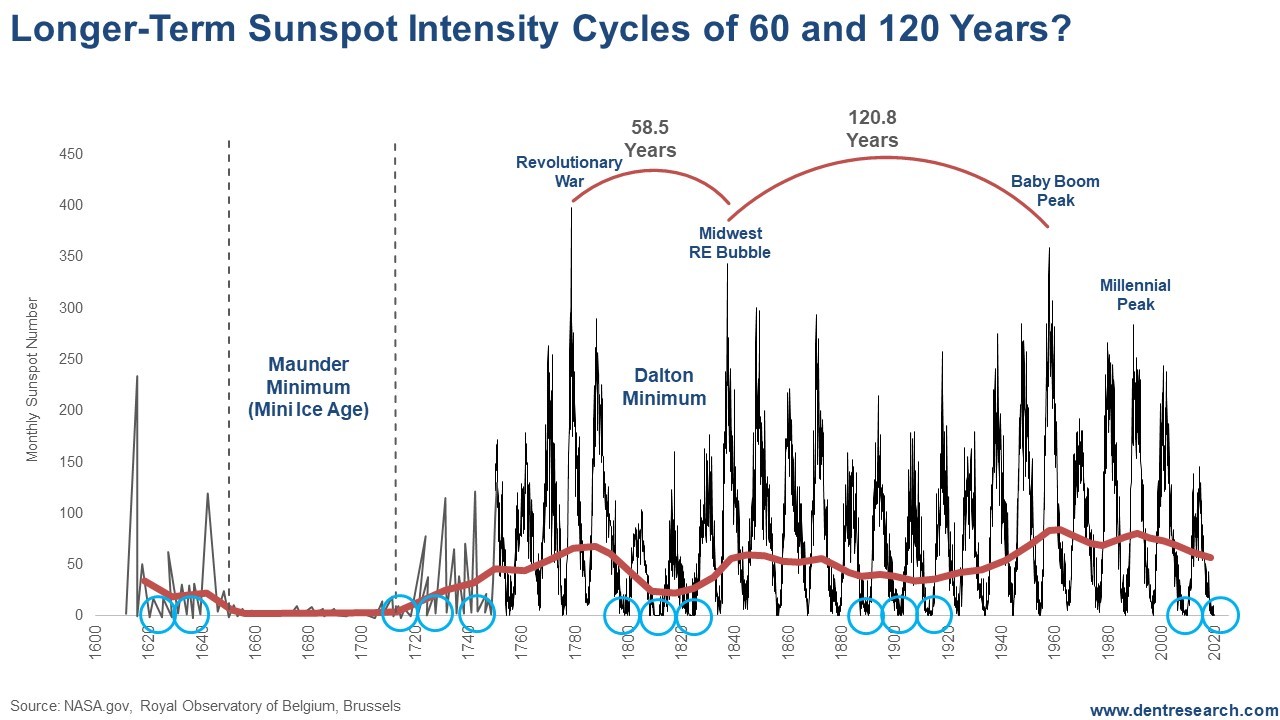
I was recently looking at the longer-term cycles, as they have been declining in intensity since the highest peak in hundreds of years in 1957… I am thinking that’s right when the massive Baby Boom birth cycle started peaking in a plateau from 1957 into 1961.
Why wouldn’t the highest energy radiation stimulate people to have more sex and more babies? Just as they spend more or speculate more in stocks when they feel more energy at the normal, plus-20% sunspot cycle top in radiation.
Then I noticed the next minor peak was in 1989, just as the Millennial births were peaking in 1990. Coincidence? I don’t think so. Births and immigration trends continue to decline after that 1889 top – not good for demographic trends in the future.
Also, look back at the last highest peak in measured history, in 1778. That was right at the beginning of the Revolutionary War and right after the Declaration of Independence. Was that a high time of energy… a major moment in American and world history?
So, I’m starting to see 60- and 120-year cycles. Inflation cycles have been historically close to 60 years, and commodity cycles, 30 years. So, this is already a natural harmonic. One scientific study found 78 significant climate swings in the last 4,500 years. That averages 58 years, very similar to the difference between the 1778 and 1836 peaks, at 58.5 years.
That 1836 peak came right at the top of the greatest westward migration and real estate boom peak in the Midwest, which was fostered by the canal revolution linking Chicago and the Midwest to the Atlantic Ocean, and heavy government stimulus with cheap land grants and low-cost easy financing.
And the 120.8-year cycle between the 1836 and 1957 peaks is roughly twice that!
The fact that intensity is continuing to decline 60 years after the last peak suggests that we could be in for a more prolonged cooling period in the decades ahead.
Scientists have realized that the 8 to 14-year variations on the 10-year average cycle are caused by the gravitational pull of Jupiter, the Earth and Venus (Mercury and Mars are too small to matter that much). Combined, that does correlate closely with the sunspot peaks and bottoms.
But these 60-year cycles would suggest impacts from Saturn.
Also, note the Mini Ice Age between 1640 and 1720 for about 80 years (midpoint at 1680). There were virtually no sunspots. The last time we had a period near that cold was around 720 AD, or about 960 years earlier. Before that was 250 BC, about 970 years before 720 AD! So, we look to also have a near 1,000-year cycle in larger cooling periods due to sunspots alone and not the larger Milankovitch 100,000-year ice age cycles.
And then, take note of the fact that when sunspot cycles move into low-intensity periods, like the Dalton Minimum and right now, the down cycles are longer and the bottoms also take longer to complete. On the chart, I marked in the blue circles all of the longer bottoms that ranged more from 3-5 years. That last one was a bit longer than average, at two years.
A minority of scientists and I see this bottom that started in late 2018 lasting into late 2021 and possibly longer. That bolsters the forecast for a major crash beginning sometime in 2020 and lasting into as late as 2022.
But here is the most important insight…
The biggest crashes and downturns tend to come in the lower intensity cycles, like the 1973-74 crash, and the one in 1929-32.
This current cycle is bottoming in the lowest intensity cycle – both since the strongest peak intensity cycle in 1957 and the lowest since the early 1820s, Dalton Minimum.
The infamous Tulip Bubble and 1720 South Seas Bubble crashes both came in very low intensity periods.
This alone forebodes a worse crash than 2007-09 and 1973-74 – both of 50%+ magnitudes. This should be more like 1929-32, or 80%+, as the 90-year Super Bubble/Great Reset Cycle also strongly suggests.
I may well do a whole article on climate change and the longer- and shorter-term sunspot cycles in The Leading Edge sometime soon, as it does seem to be more than meets the eye… and it’s the fourth cycle in my hierarchy and critical to pinpointing recessions and more serious stock corrections.
Author

Harry S. Dent, MBA
Dent Research
Harry S. Dent Jr. studied economics in college in the ’70s, but found it vague and inconclusive. He became so disillusioned by the state of his chosen profession that he turned his back on it.


