The S&P and Two Moon Days

Chaos Clinic for 4/30/2021
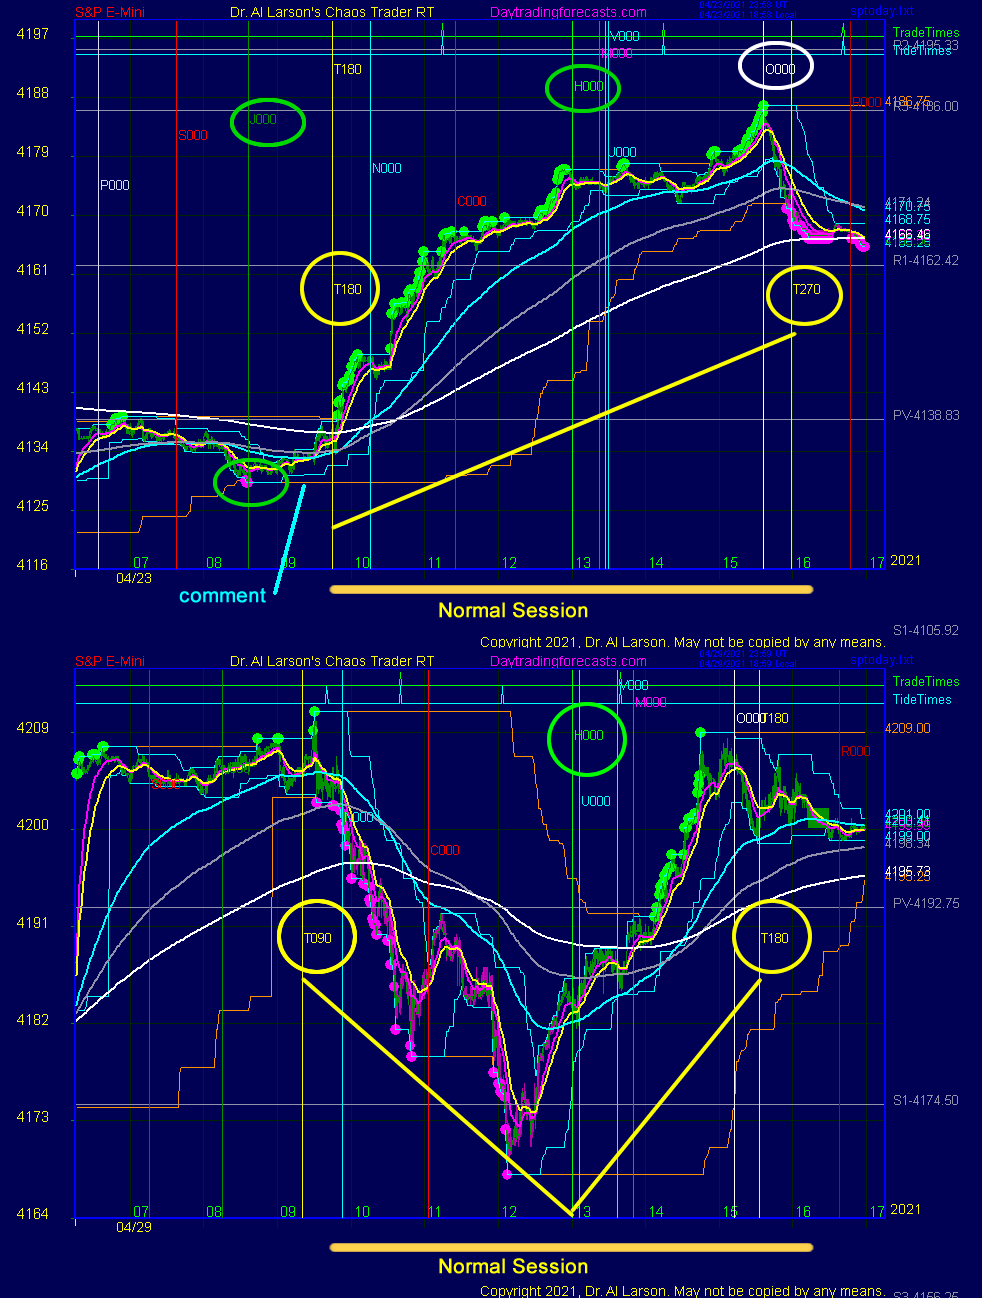
The charts above shows the S&P futures on 4/23/2021 and 4/29/2021 . They show what I call a "Two Moon Day." These are days when the rotating Earth moves the New York Stock Exchange to form an aspect of 0, 90, 180, or 270 degrees to the Moon.
Two Moon days are often volatile and tend to move Moon to Moon, or Moon, Noon, Moon.
On the top chart, these Moon timelines are shown by the vertical yellow lines, labeled T180 and T270. The 180 is the 180 degree opposition, and the 270 is a square. This chart was from a Chaos Clinic day, and just before the outcry session I made a comment in the chat room to watch for a Two Moon Day.
I thought this pattern might develop based on the minor low near 8:30, which came precisely at the time that the Exchange rotated to align with Jupiter (J000). Following that point the rainbow of EXMAs turned up. These are the usual 20, 110, 220, and 440 minute EXMAs used on http://daytradingforecasts.com.
Also shown on the chart are "pit pivot" prices. These are harmonic price levels computed from the prior day's trading. The green and pink "push balls" highlight buying and selling pressures.
The other vertical lines show the Exchange aligning with Pluto (P), Saturn (S), Jupiter (J), Neptune (N), Chiron (C), Sun (H), Venus (V), Uranus (U), Node (O), and Mars (R).
Note that the rally slowed and went flat at solar noon, H. Then near the end of the trading day the rally resumed with a fast move up to the Node timeline. The high was EXACTLY on the Node timeline, just as the low was EXACTLY on the Jupiter timeline. While the general "Two Moon" tendency was present, the exactness of the high and low are strong evidence that even in this time of computerized trading, that the energy the algos track is related to the complex electromagnetic field of our solar system.
The second chart is six days later. It is a good example of the Moon-Noon-Moon pattern.
This content was published on Dr. Al Larson's Chaos Clinic which you can attend each Friday for free.
Dr. Al Larson has developed a complete Chaos Model of Markets, four unique courses that let you become a Certified Chaos Trader, some very unique eMylar fractal pattern overlays, and tools that permit forecasting individual stocks and markets years in advance. You can also sign up for a free weekly email, and attend a free Chaos Clinic on Fridays. To learn more, click on the author's profile.
Be sure to sign up for the free weekly email!
Author

Dr. Al Larson, PhD
MoneyTide.com
Dr. Al Larson holds a Ph.D. in Electrical and Computer Engineering from the University of Wisconsin. He is a 1964 Distinguished Graduate of the U. S. Air Force Academy.


