|

Moderate change in trend US stocks, T-bonds, US Dollar

12/06 Recap: - The S&P opened with a 10 handle gap up and then steadily moved up 65 handles into a 2:03 PM high of the day.  From that low, the S&P gradually decline 14 handles into the close.

SP500

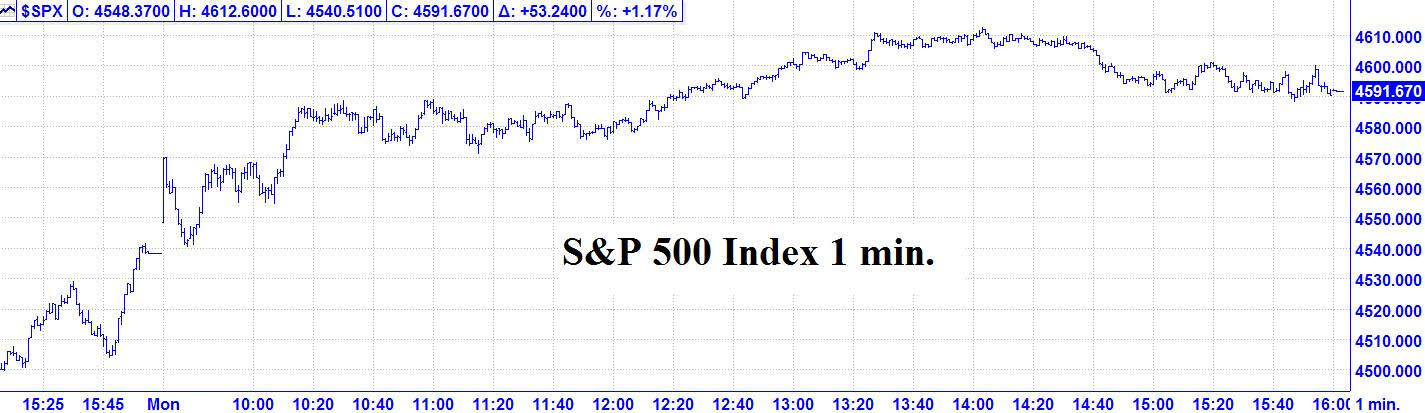
12/06 – The major indices, closed with a strong up day. The 12/06 closes are as follows: The DJIA + 646.95; S&P 500 + 53.24; and the Nasdaq Composite  + 139.68. 

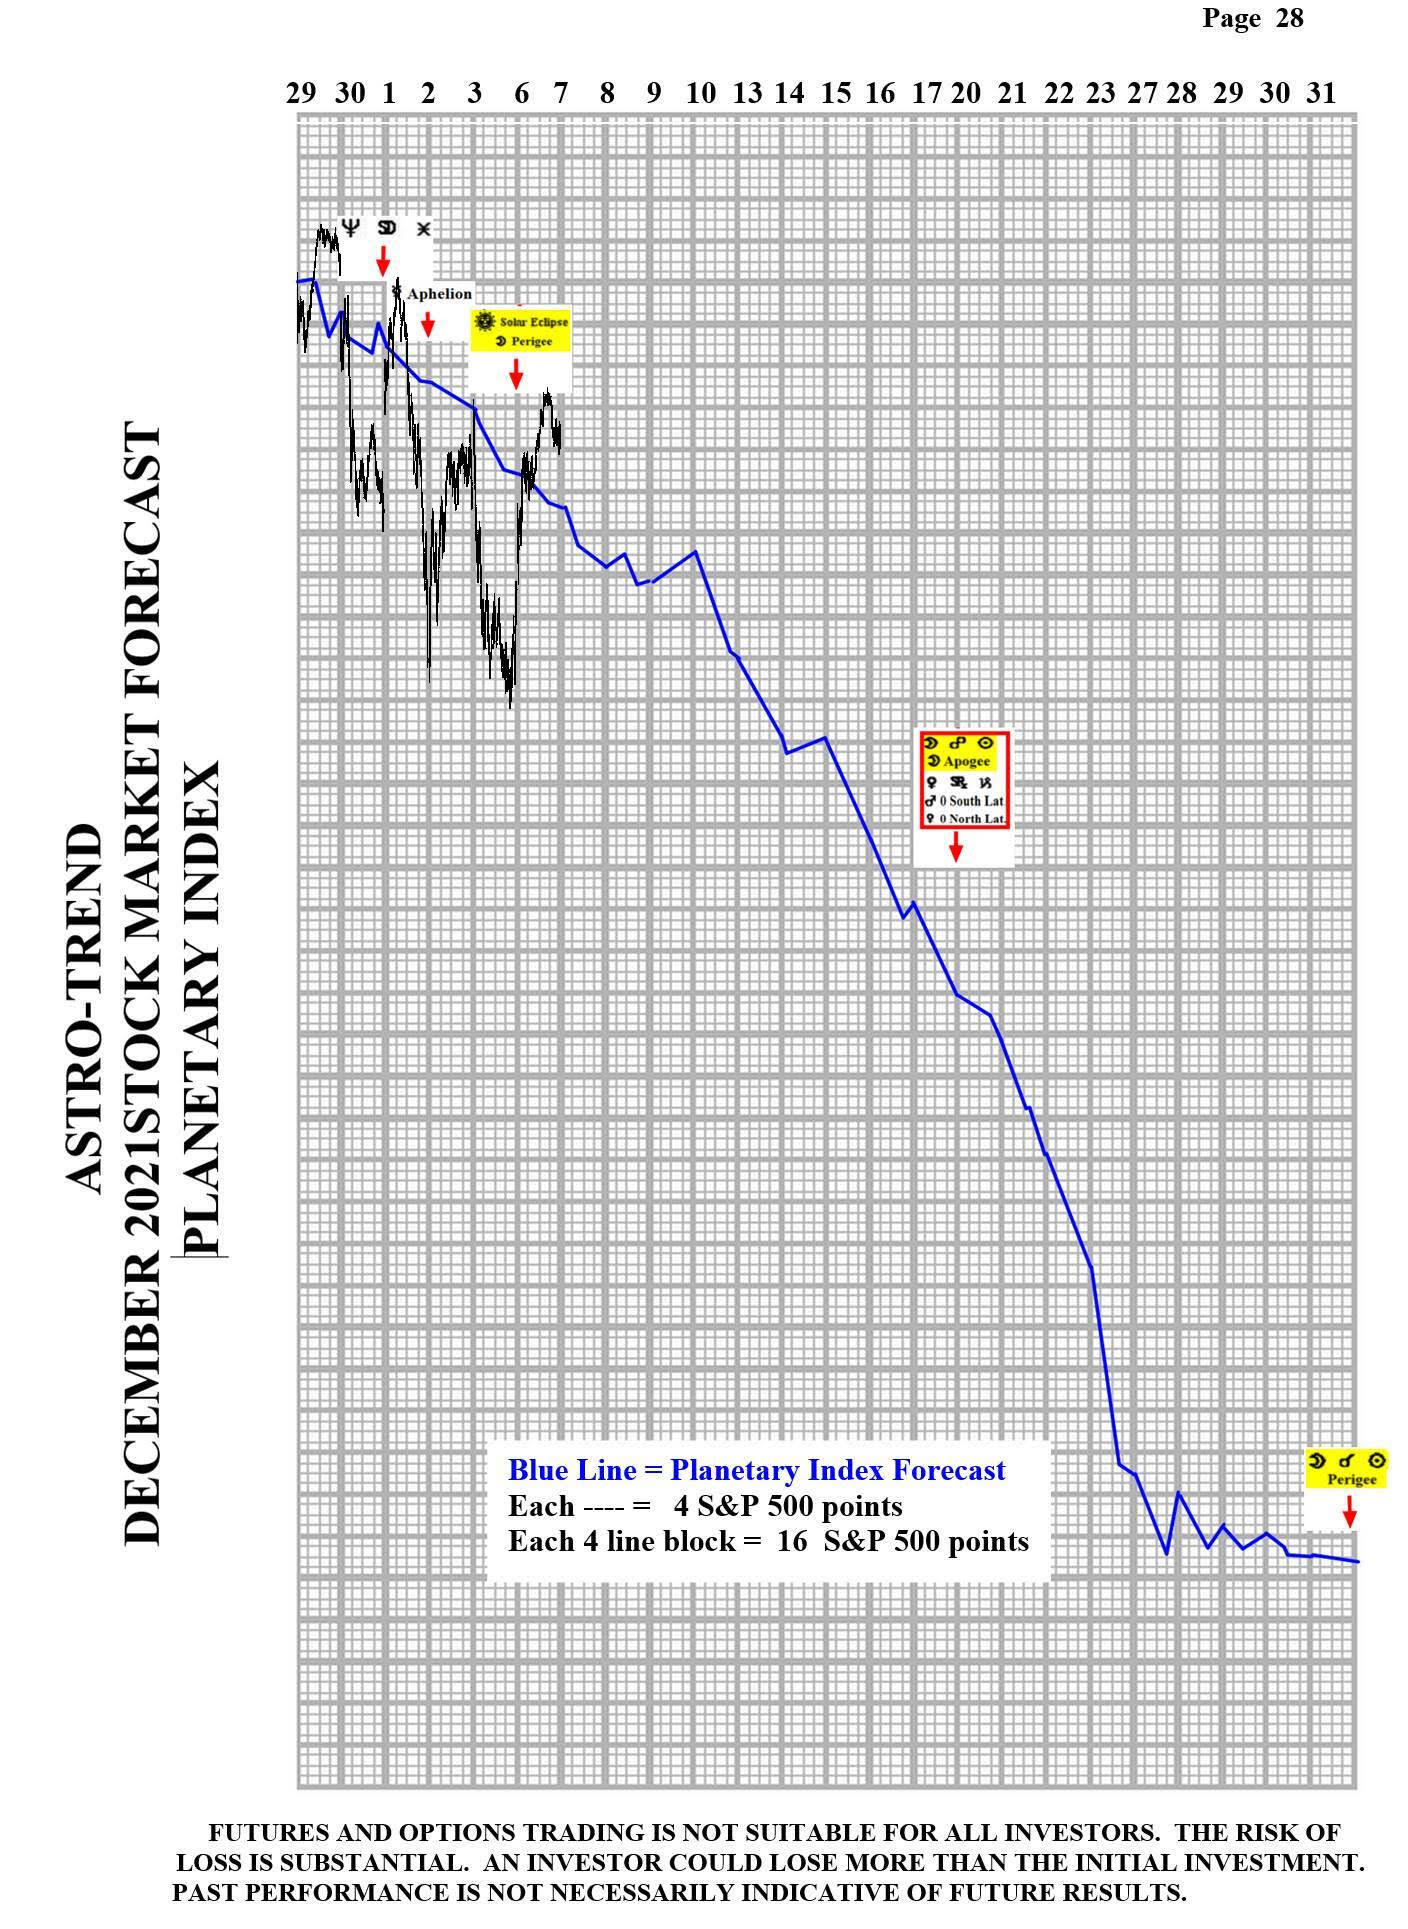
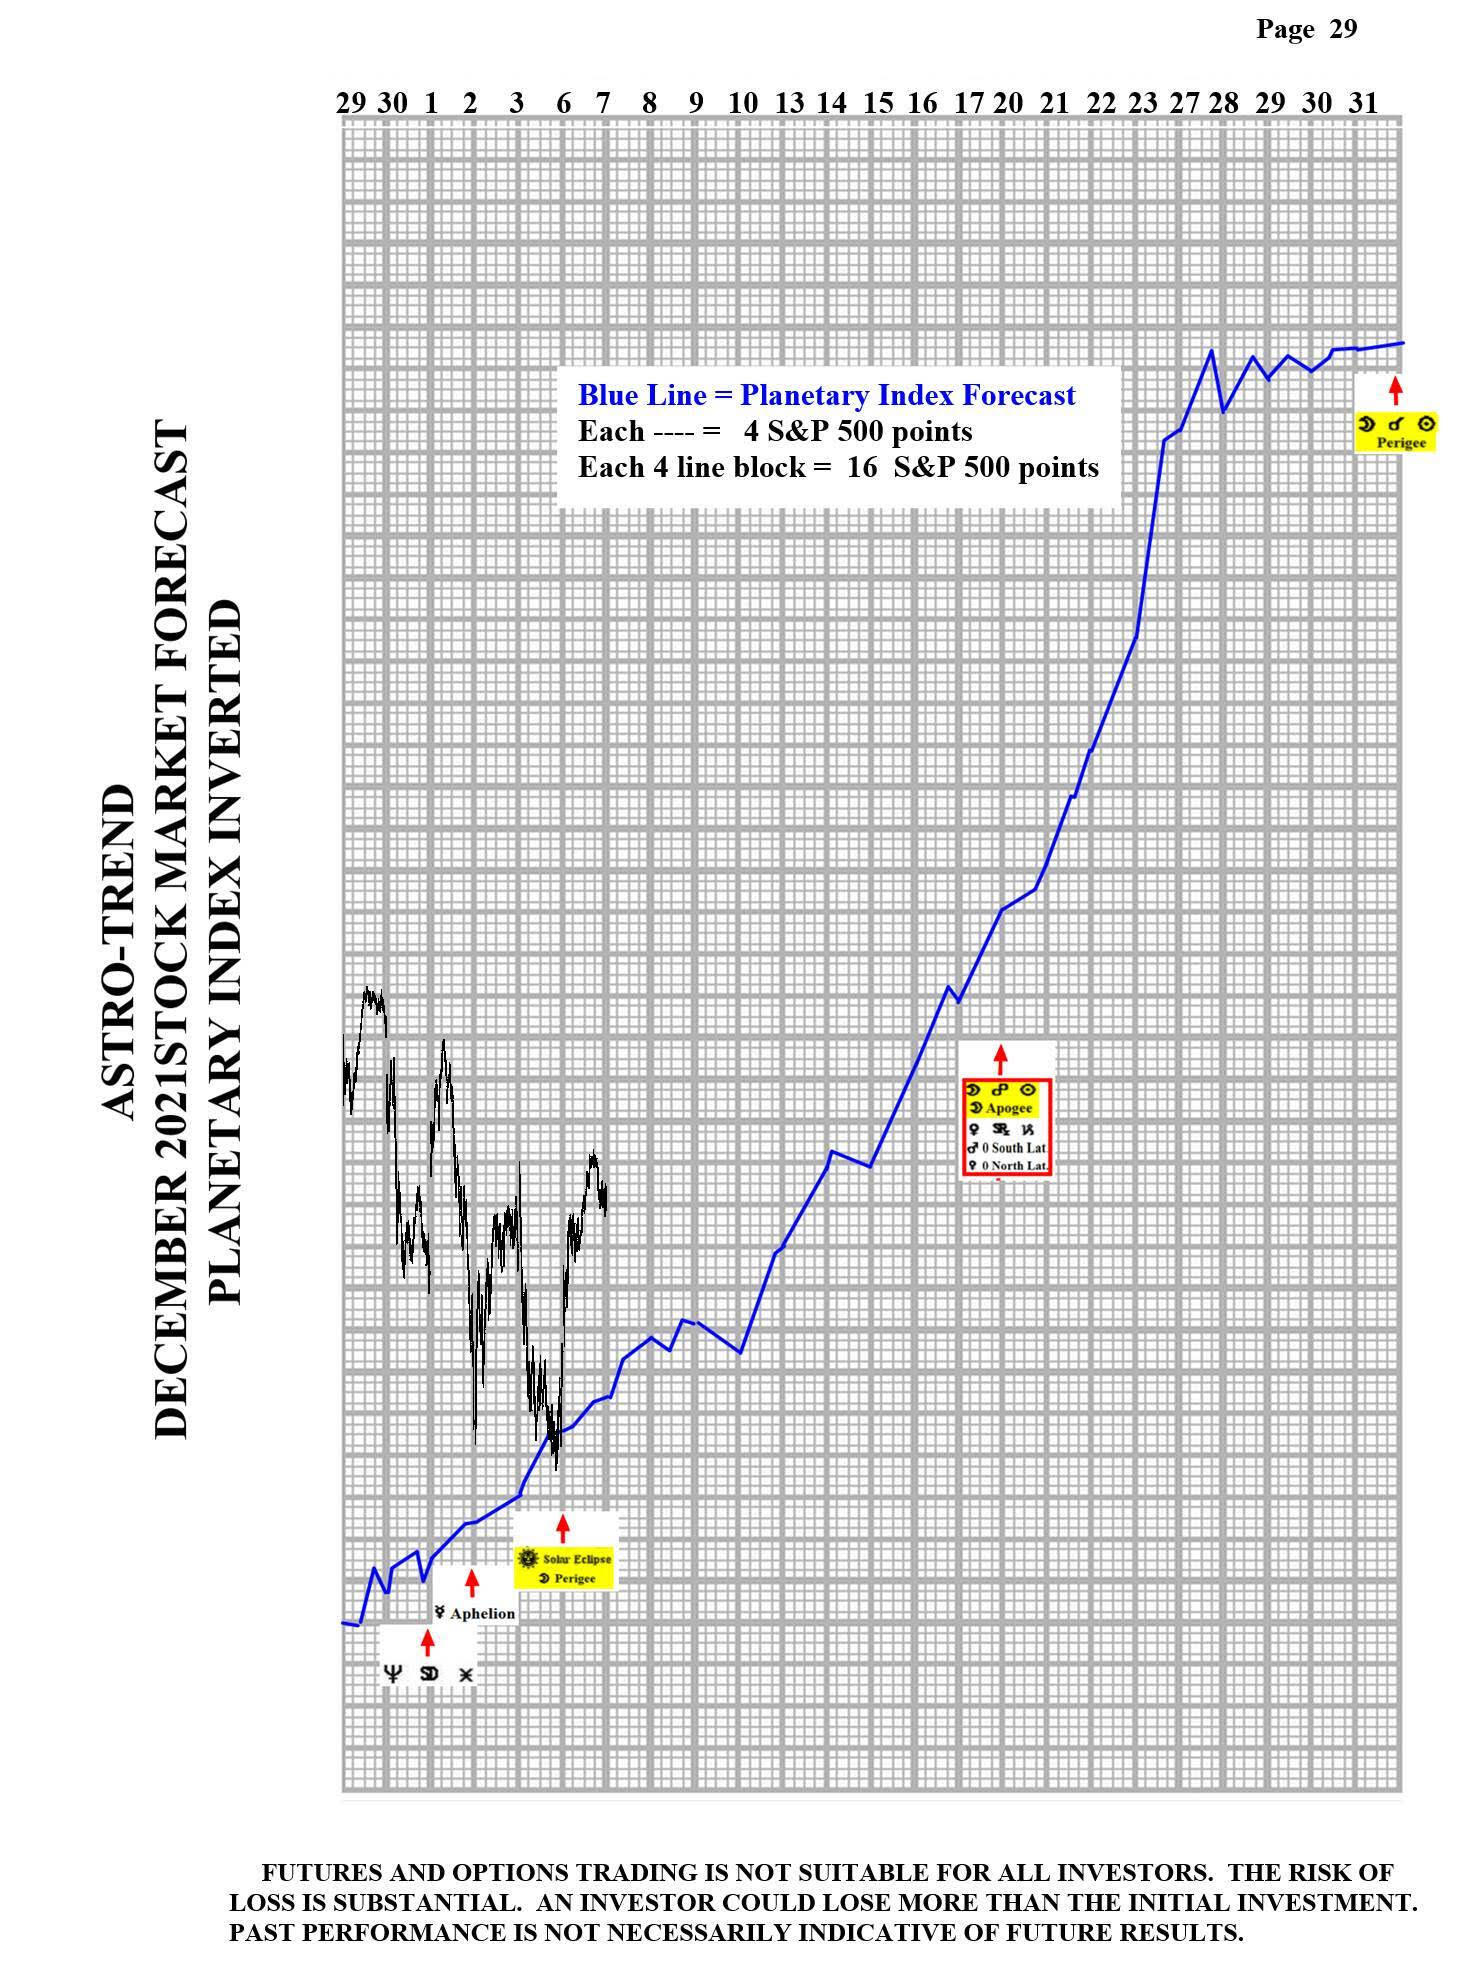
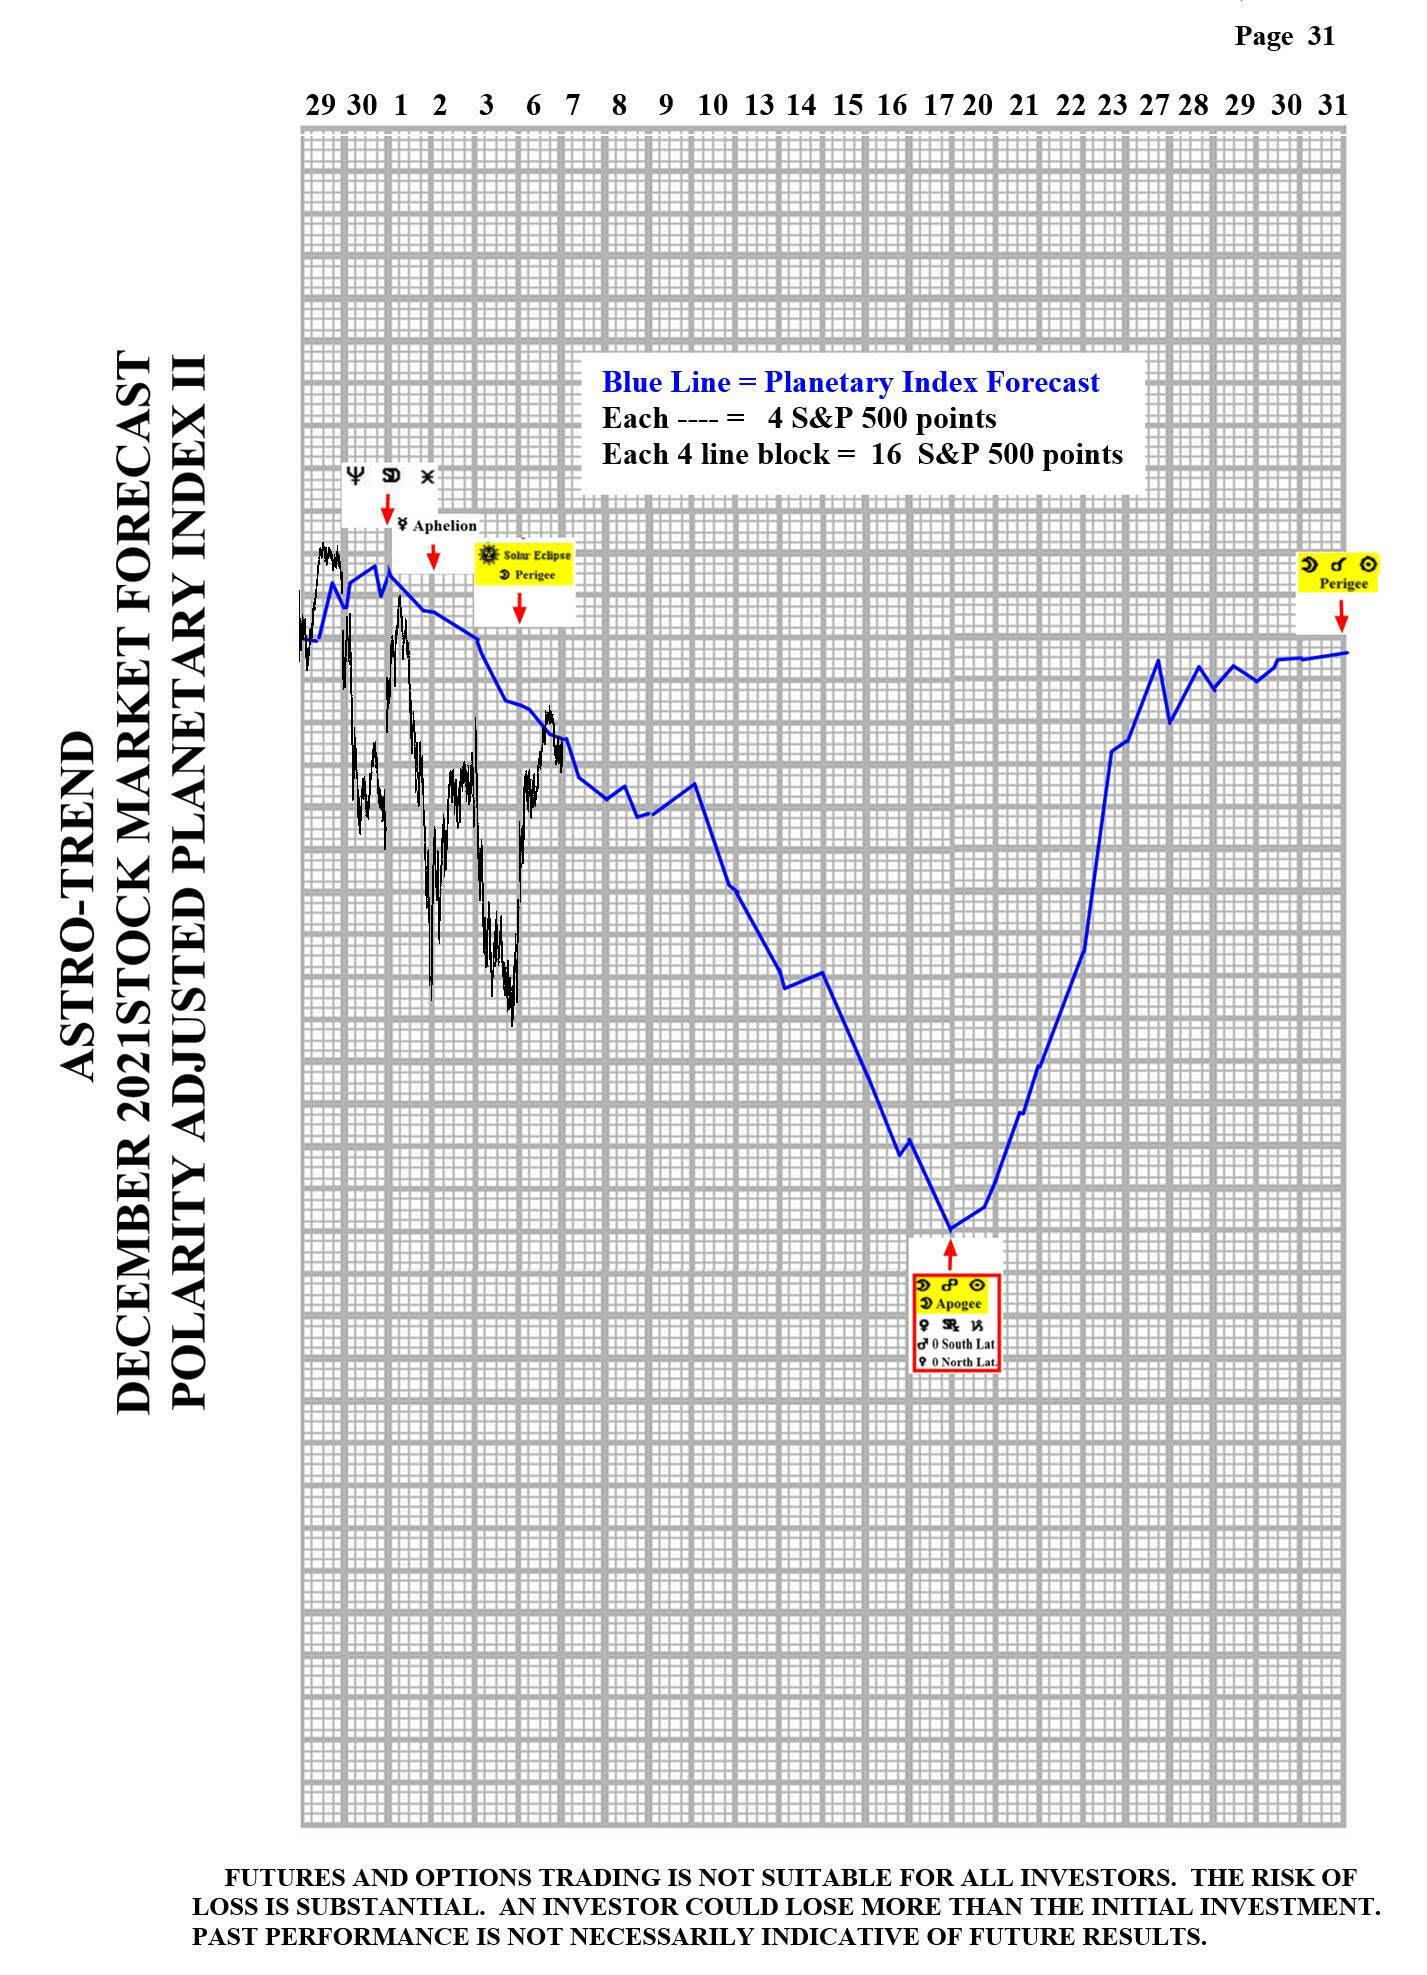
Looking ahead  – Looks we the S&P put in its Solar Eclipse low late Friday.  Now, the Astro picture is relative quiet for the next two weeks.  Newton's First Law of Motion states that a body at rest will remain at rest unless an outside force acts on it, and a body in motion at a constant velocity will remain in motion in a straight line unless acted upon by an outside force. With that in mind, whatever trend is established by Tuesday, and that currently is looking like an uptrend, is likely to be the trend into about 12/17, which is the next major change in trend window.  However, with Geo Mars changing signs over the 12/10 weekend, there may be a brief correction. 

The NOW Index is in the BUY ALERT ZONE.  This is a cautionary indication for the bears that there is a moderate imbalance of too many shorts.

Coming events

(Stocks potentially respond to all events).  

2. A. 12/10 AC – Geo Mars enters Sagittarius.  Important change in trend Oats. 

    B. 12/12 AC – Jupiter 45 US Part of Fortune.  Moderate change in trend US Stocks, T-Bonds, US Dollar.

    C. 12/15 AC – Jupiter 135 US Sun.  Moderate change in trend US Stocks, T-Bonds, US Dollar.

     Stock Market Key Dates –

Market math

12/26 – 676 Days (26^2) from the 2/19/2020 major high.

12/28 – 15,54 (112^2) from the 8/25/1987 major high. 

DJIA – 12/13, 12/22, 12/29, 12/31 AC.

Fibonacci – 12/10, 12/16, 12/20, 12/28, 12/30.

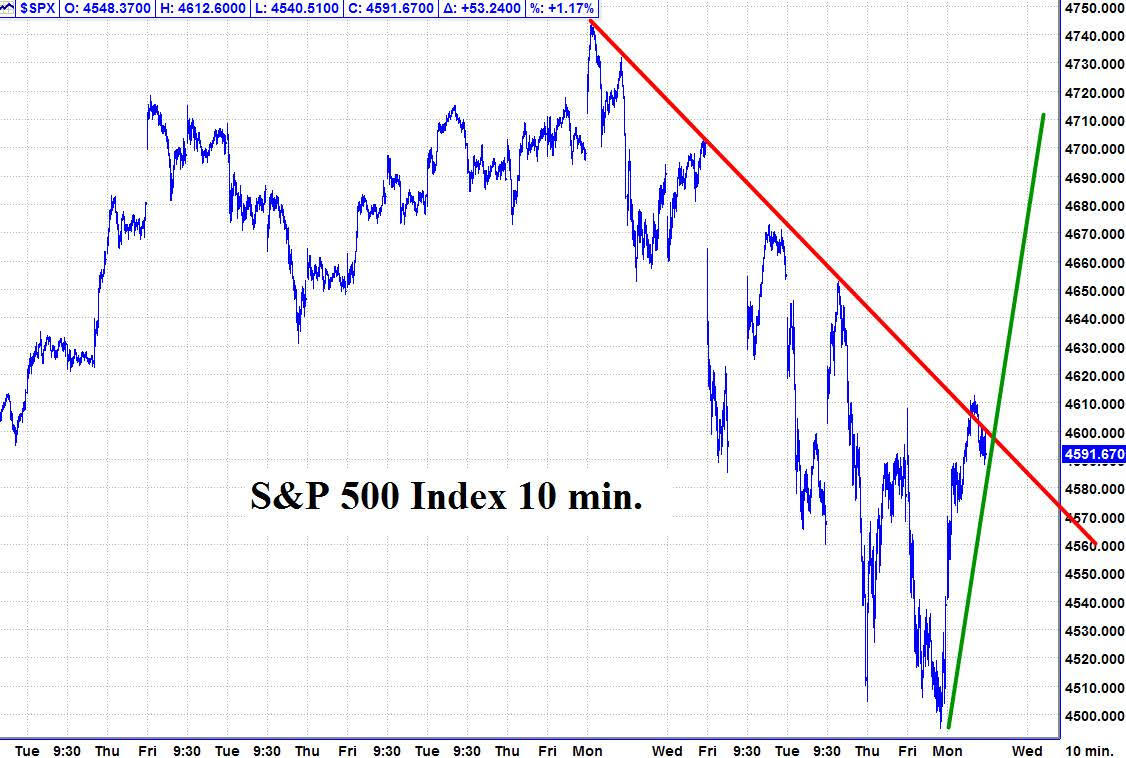
Please see below the S&P 500 10 minute chart.    

Support  - 4541  Resistance – 4613.

SP500

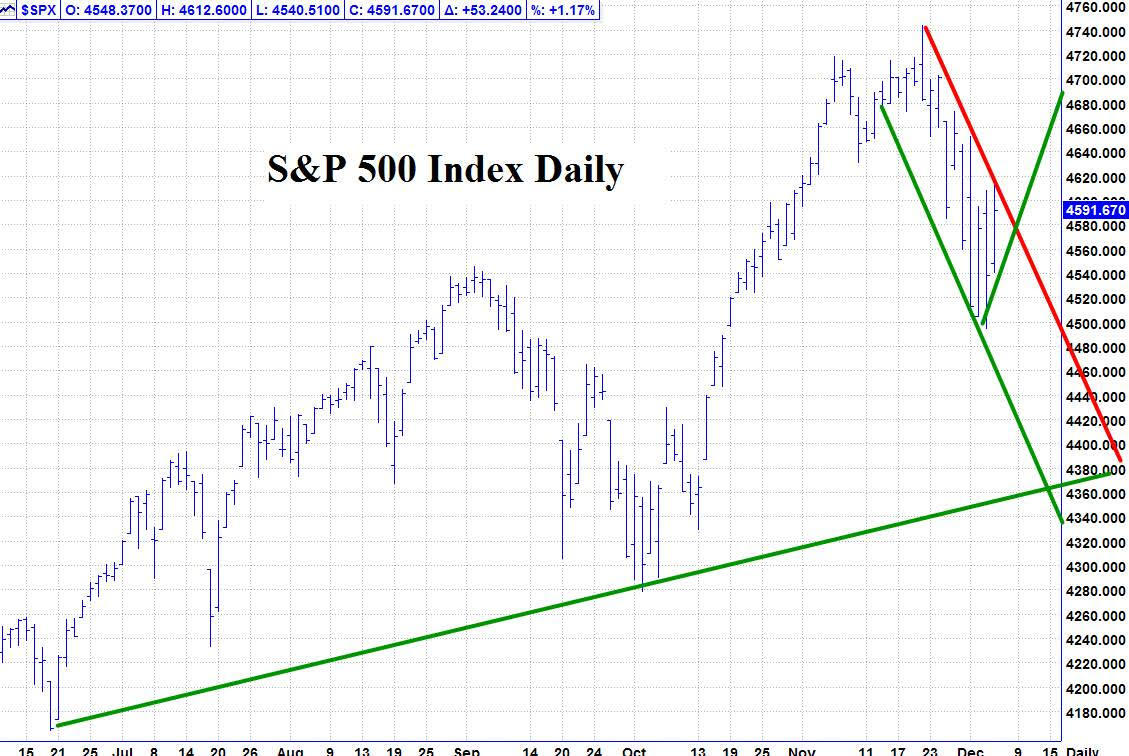
Please see below the S&P 500 Daily chart.                                        

Support  - 4541  Resistance – 4613.

SP500
Please see below the Planetary Index charts with S&P 500 5 minute bars for results.          
SP500
SP500
SP500
SP500

Author

Norm Winski

Norm Winski

Independent Analyst

www.astro-trend.com

More from Norm Winski
Share:

Markets move fast. We move first.

Orange Juice Newsletter brings you expert driven insights - not headlines. Every day on your inbox.

By subscribing you agree to our Terms and conditions.

Editor's Picks

EUR/USD rebounds after falling toward 1.1700

EUR/USD gains traction and trades above 1.1730 in the American session, looking to end the week virtually unchanged. The bullish opening in Wall Street makes it difficult for the US Dollar to preserve its recovery momentum and helps the pair rebound heading into the weekend.

GBP/USD steadies below 1.3400 as traders assess BoE policy outlook

Following Thursday's volatile session, GBP/USD moves sideways below 1.3400 on Friday. Investors reassess the Bank of England's policy oıtlook after the MPC decided to cut the interest rate by 25 bps by a slim margin. Meanwhile, the improving risk mood helps the pair hold its ground.

Gold stays below $4,350, looks to post small weekly gains

Gold struggles to gather recovery momentum and stays below $4,350 in the second half of the day on Friday, as the benchmark 10-year US Treasury bond yield edges higher. Nevertheless, the precious metal remains on track to end the week with modest gains as markets gear up for the holiday season.

Crypto Today: Bitcoin, Ethereum, XRP rebound amid bearish market conditions

Bitcoin (BTC) is edging higher, trading above $88,000 at the time of writing on Monday. Altcoins, including Ethereum (ETH) and Ripple (XRP), are following in BTC’s footsteps, experiencing relief rebounds following a volatile week.

How much can one month of soft inflation change the Fed’s mind?

One month of softer inflation data is rarely enough to shift Federal Reserve policy on its own, but in a market highly sensitive to every data point, even a single reading can reshape expectations. November’s inflation report offered a welcome sign of cooling price pressures. 

XRP rebounds amid ETF inflows and declining retail demand demand

XRP rebounds as bulls target a short-term breakout above $2.00 on Friday. XRP ETFs record the highest inflow since December 8, signaling growing institutional appetite.