The S&P 500 made a new high

USD: Sept '24 is Down at 104.560.
Energies: Aug '24 Crude is Up at 82.32.
Financials: The Sept '24 30 Year T-Bond is Down 1 tick and trading at 118.23
Indices: The Sept '24 S&P 500 emini ES contract is 28 ticks Lower and trading at 5681.00.
Gold: The Aug'24 Gold contract is trading Up at 2387.20
Initial conclusion
This is not a correlated market. The USD is Down and Crude is Up which is normal, and the 30 Year T-Bond is trading Down. The Financials should always correlate with the US dollar such that if the dollar is Higher, then the bonds should follow and vice-versa. The S&P is Lower and Crude is trading Higher which is correlated. Gold is trading Higher which is correlated with the US dollar trading Down. I tend to believe that Gold has an inverse relationship with the US Dollar as when the US Dollar is down, Gold tends to rise in value and vice-versa. Think of it as a seesaw, when one is up the other should be down. I point this out to you to make you aware that when we don't have a correlated market, it means something is wrong. As traders you need to be aware of this and proceed with your eyes wide open. Asia traded mainly Higher with the exception of the Indian Sensex exchange. Currently all of Europe is trading Higher.
Possible challenges to traders
-
Core CPI m/m is out at 8:30 AM EST. This is Major.
-
CPI m/m is out at 8:30 AM EST. This is Major.
-
CPI y/y is out at 8:30 AM EST. This is Major.
-
Unemployment Claims are out at 8:30 AM EST. This is Major.
-
Natural Gas Storage is out at 10:30 AM EST. This is Major.
-
FOMC Member Bostic Speaks at 11:30 AM EST. This is Major.
-
FOMC Member Musalem Speaks at 1 PM EST. This is Major.
-
30-y Bond Auction starts at 1 PM EST. This is Major.
-
Federal Budget Balance is out at 2 PM EST. This is Major.
Traders, please note that we've changed the Bond instrument from the 10 year (ZN) to the 2 year (ZT). They work exactly the same.
We've elected to switch gears a bit and show correlation between the 10-year Treasury notes (ZN) and the S&P futures contract. The YM contract is the Dow Jones Industrial Average, and the purpose is to show reverse correlation between the two instruments. Remember it's likened to a seesaw, when up goes up the other should go down and vice versa.
Yesterday the ZT dived Lower at around 8:15 AM EST after hitting a High. If you look at the charts below the ZT gave a signal at around 8:15 AM and started its Downward slide. Look at the charts below and you'll see a pattern for both assets. The Dow moved Higher at 8:15 AM and the ZT moved Lower at around the same time. These charts represent the newest version of BarCharts and I've changed the timeframe to a 15-minute chart to display better. This represented a Short opportunity on the 2-year note, as a trader you could have netted about 20 plus ticks per contract on this trade. Each tick is worth $7.625. Please note: the front month for ZT is Sept and the Dow is now Sept '24. I've changed the format to filled Candlesticks (not hollow) such that it may be more apparent and visible.
Charts courtesy of barcharts
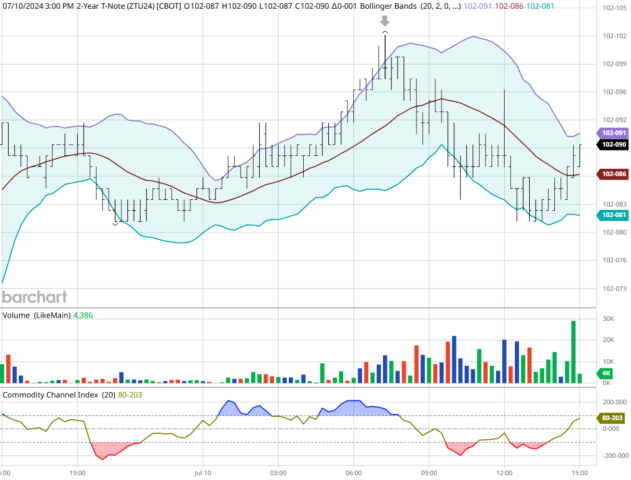
ZT -Sept 2024 - 07/10/24
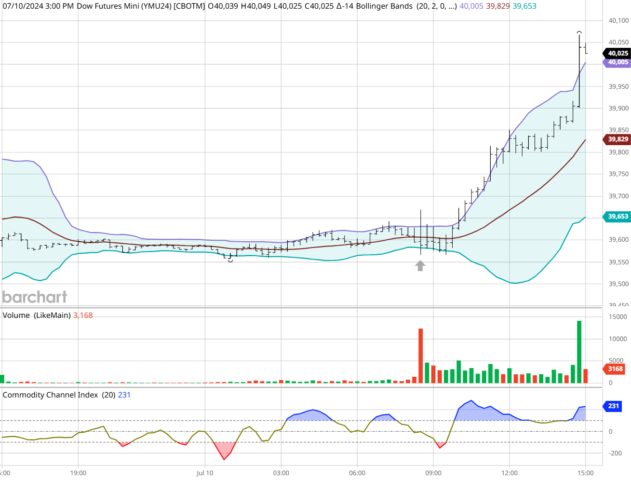
Dow - Sept 2024 - 07/10/24
Bias
Yesterday we gave the markets an Upside bias and the markets didn't disappoint as the Dow moved Higher by 439 points and the other indices moved Higher as well. Today we aren't dealing with a correlated market and our bias is to the Downside.
Could this change? Of Course. Remember anything can happen in a volatile market.
Commentary
What a difference a day makes. On Tuesday Fed Chair Powell spoke but gave no indication as to the timing of a possible interest rate reduction. Yesterday during his Congressional testimony, he stated that the Federal Reserve was "thinking" about a possible interest rate reduction around September. No sooner did he say that when the markets went wild, and the Dow closed 439 points Higher. The S&P made a new High today and the Nasdaq traded Higher by 218 points. Will this frenzy continue? Only time will tell but today we have a mini news tsunami in that we have about 9 economic reports, all of which are major.
Author

Nick Mastrandrea
Market Tea Leaves


