The smart money says, “past performance is no indication of future performance”

My goal was to make $50K in Crypto this year. Only $70K more to go…
S2N spotlight
Longtime readers know that I like to pick on Michael Saylor from Micro”Strategy”, I still feel the need to call it by its old name. I believe Saylor is drunk on his own messianic complex. I saw him tweet the most corny 21 rules about Bitcoin today and decided to dedicate today’s spotlight on him.
Here is what I did. Saylor raised roughly $42 billion dollars to spend over 3 years from 30 October 2024. He spent about $21 billion in less than 4 months at an average of $97,000 per Bitcoin.
My gripe is that if you have 3 years to invest the money, wouldn’t it be prudent to invest it steadily over the 3 years. One more piece of housekeeping. As we don’t know what the 3 year future will look like from 30 October 2024, we need to make an assumption. I chose to choose any random period over the last 10 years and transform that into a future price chart of Bitcoin. Let me share 3 results and then let us discuss the results.
Version 1.
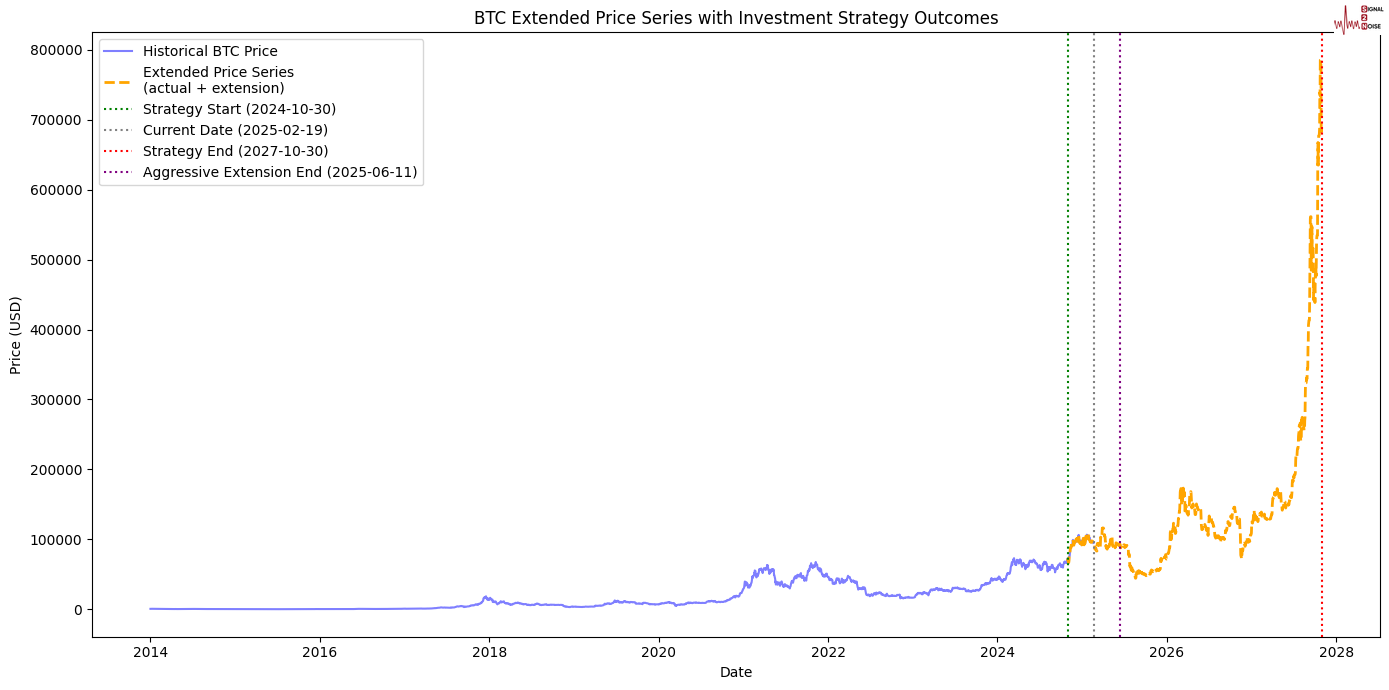
Final BTC Price on 2027-10-30: $687,969.70
Steady strategy:
Total BTC acquired: 388,628.3256
Portfolio Value: $267,364,513,957.40
Average Purchase Price: $108,072.41
Aggressive saylor strategy:
Total BTC acquired: 383,912.4237
Portfolio Value: $264,120,116,383.14
Average Purchase Price: $109,399.95.
Version 2.
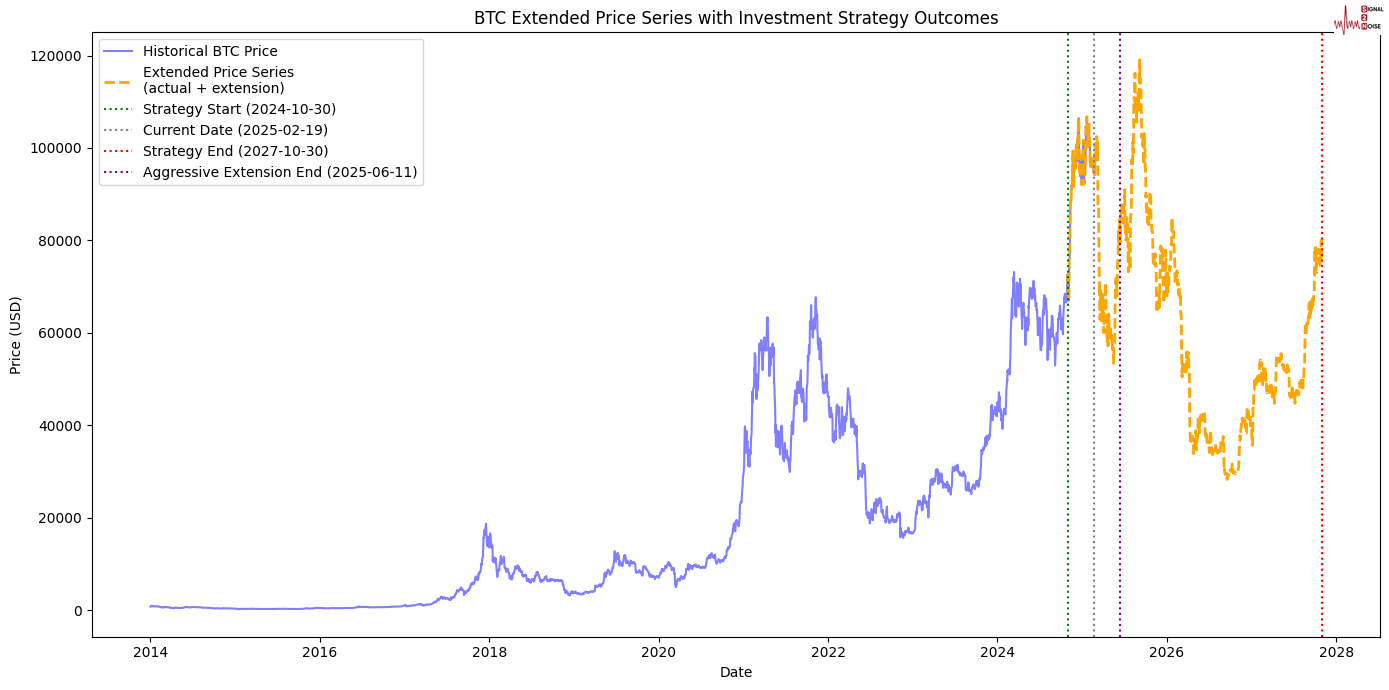
Final BTC Price on 2027-10-30: $76,324.75.
Steady strategy:
Total BTC acquired: 754,247.7427
Portfolio Value: $57,567,769,663.59
Average Purchase Price: $55,684.62
Aggressive saylor strategy:
Total BTC acquired: 468,149.5105
Portfolio Value: $35,731,393,892.35
Average Purchase Price: $89,714.93
Concluding thoughts:
No matter how many times I run the code, Saylor is mostly beaten. Despite the fact that the data I used in my forecast has an average rolling 3-year return of 571%.
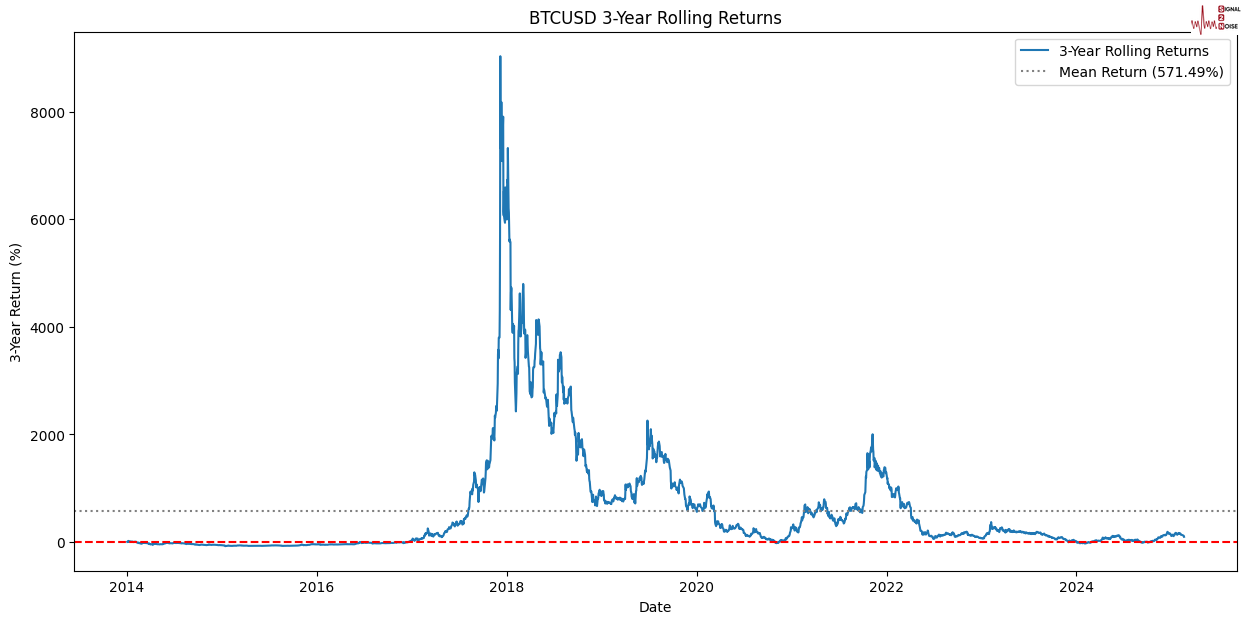
My granny taught me that slow and steady wins the race. The smart money says, “past performance is no indication of future performance.”
Le’chaim Mr Saylor.
S2N observations
I think AI’s progress over the last couple of years has changed a lot. But I think it is going to be even more dramatic in the next few years. Professor Nouriel Roubini shared a wild forecast on a podcast recently.
He predicted we would see economic growth of around 6% with unemployment of around 70%. Try wrap your head around that one.
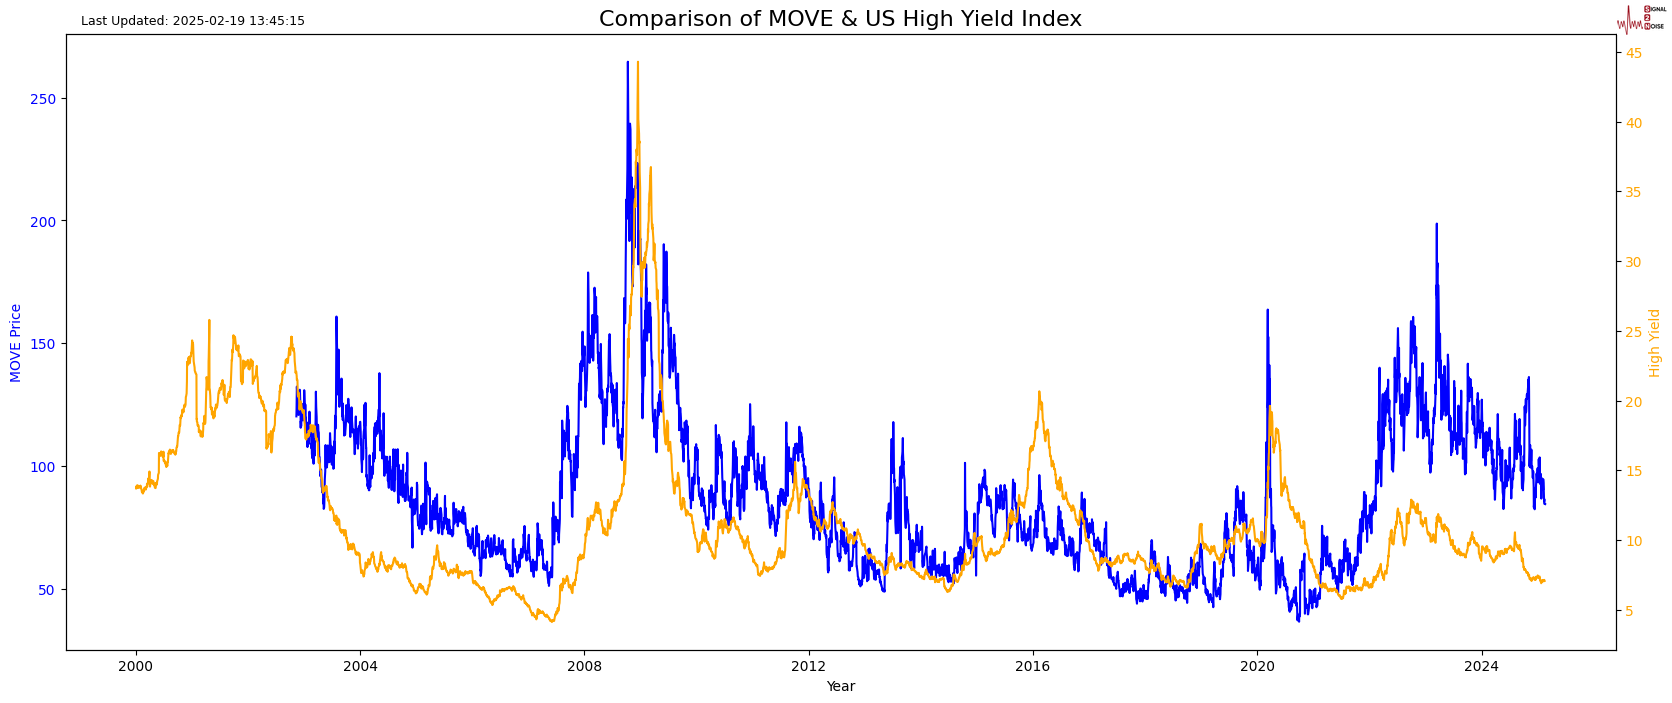
I believe the yield on high yield corporate bonds (junk) is too low. We are not that far from the levels that proceeded the subprime crisis. The MOVE index is to bonds what the VIX is to stocks. That is a measure of volatility. I think there are opportunities to trade around this theme.
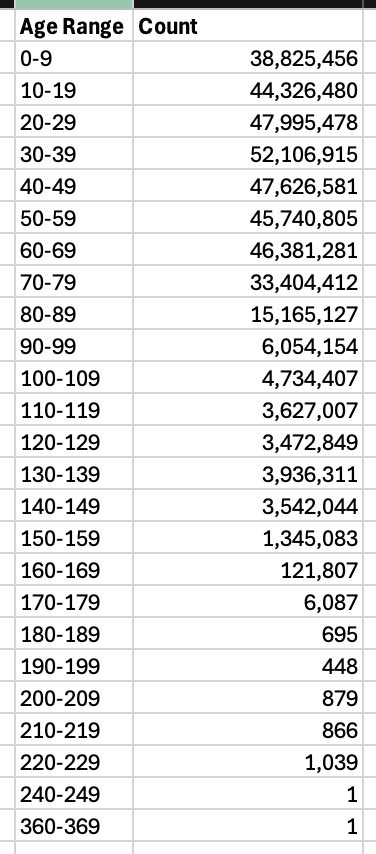
I often have too much to say about Elon Musk. I truly admire him in so many ways. With my Austrian Economic principles favouring a small government, this spreadsheet from Musk is priceless, and a wonderful case study for wasteful government spending. Here is a quote from him.
“Having tens of millions of people marked in Social Security as “ALIVE” when they are definitely dead is a HUGE problem. Some of these people would have been alive before America existed as a country.
Your Fired!!
S2N screener alerts
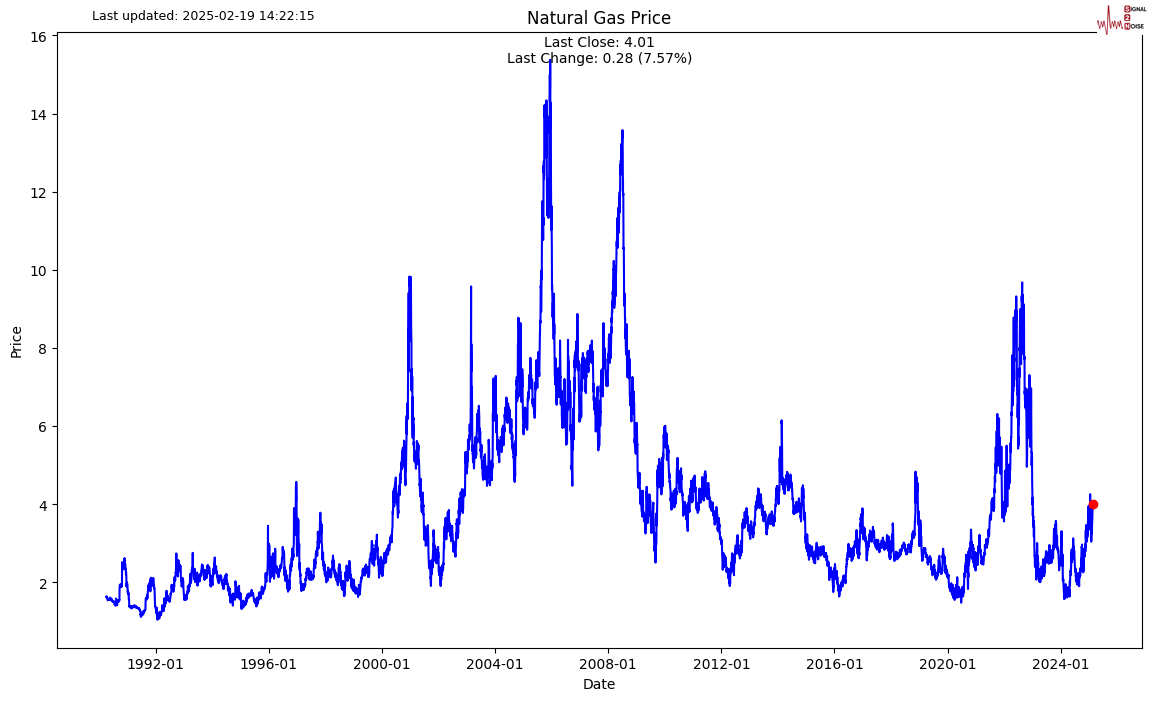
Natural Gas had another 3-sigma up day, which is not so natural. In theory, these should happen every 700 odd days, not every 35 days. Even though my stats look at 35 years of data, I only show the last 2 years so that the alerts are more readable, which is not the case with “Un”Natural Gas.
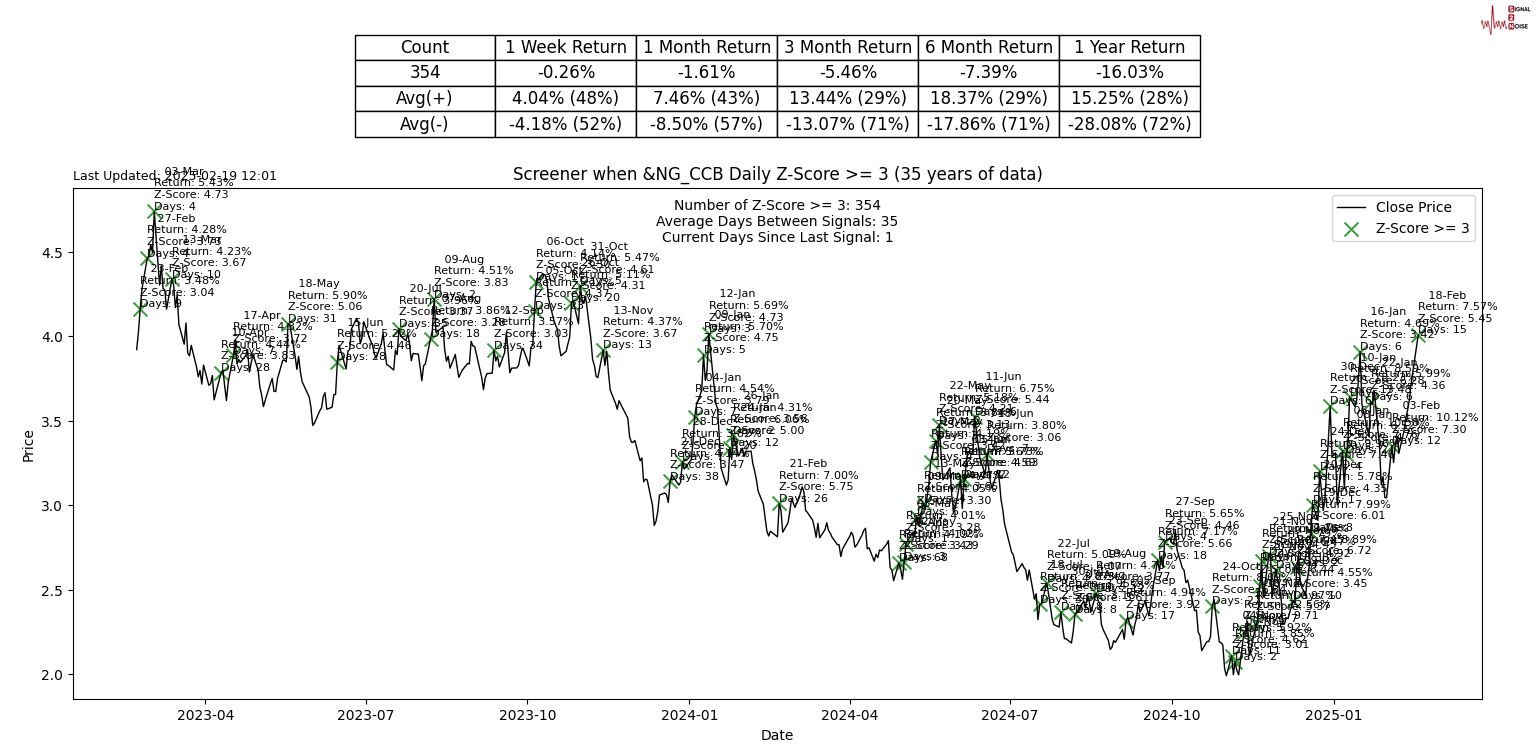
For the sake of completeness, I added a long chart.
Performance review
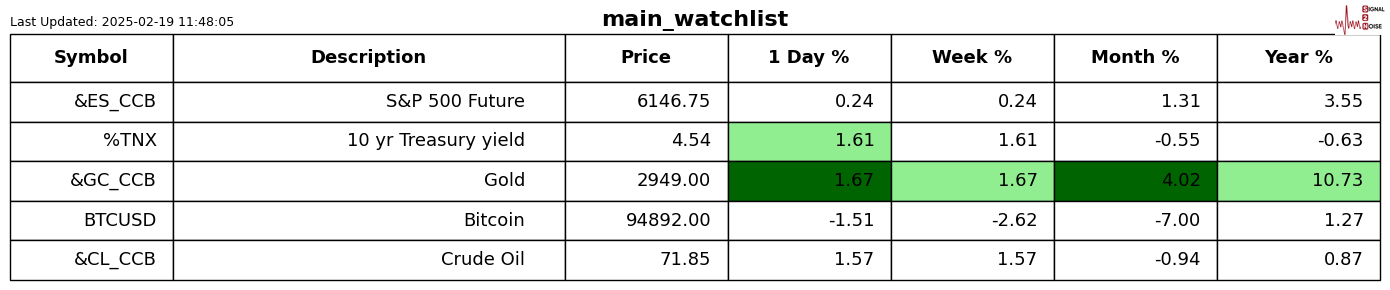
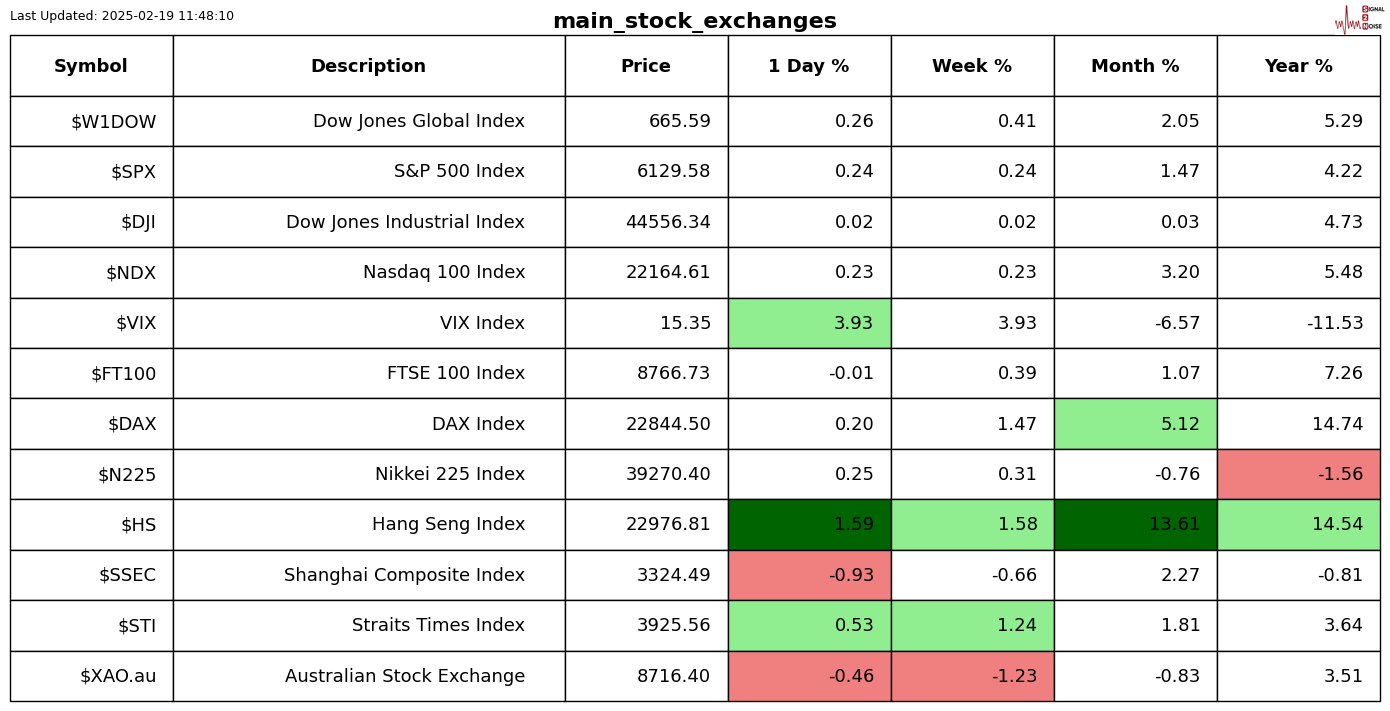
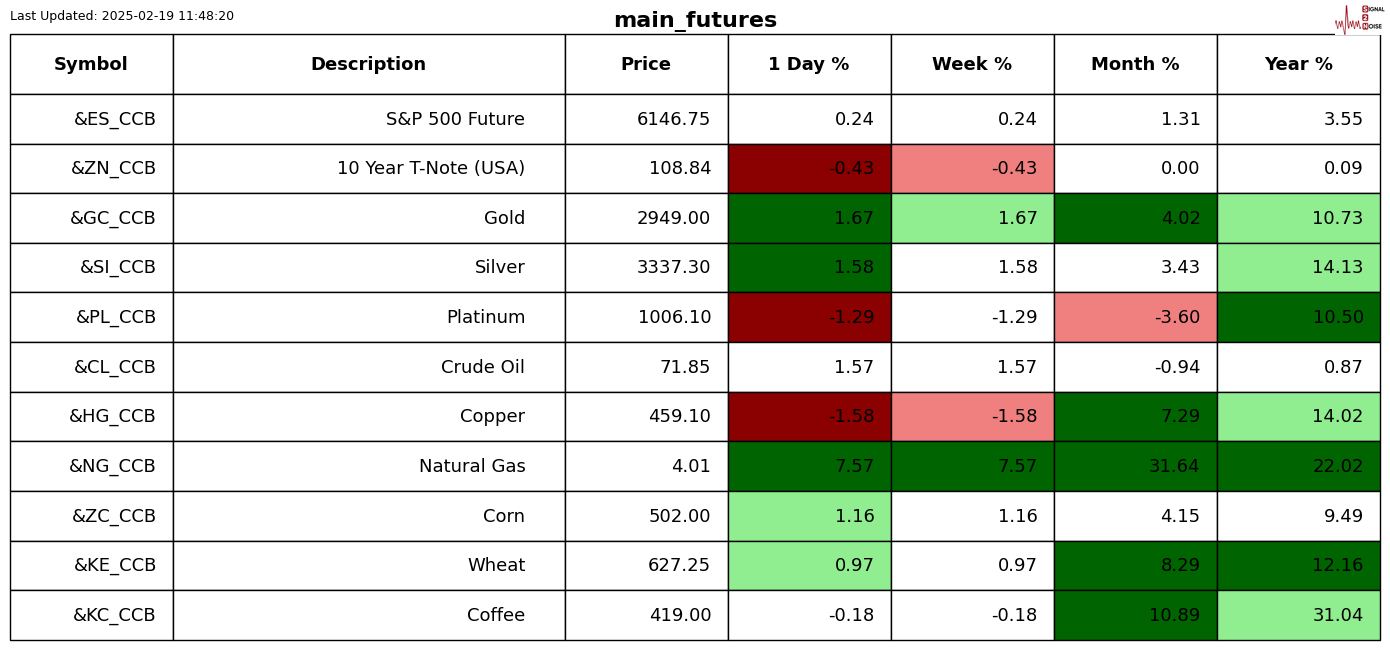
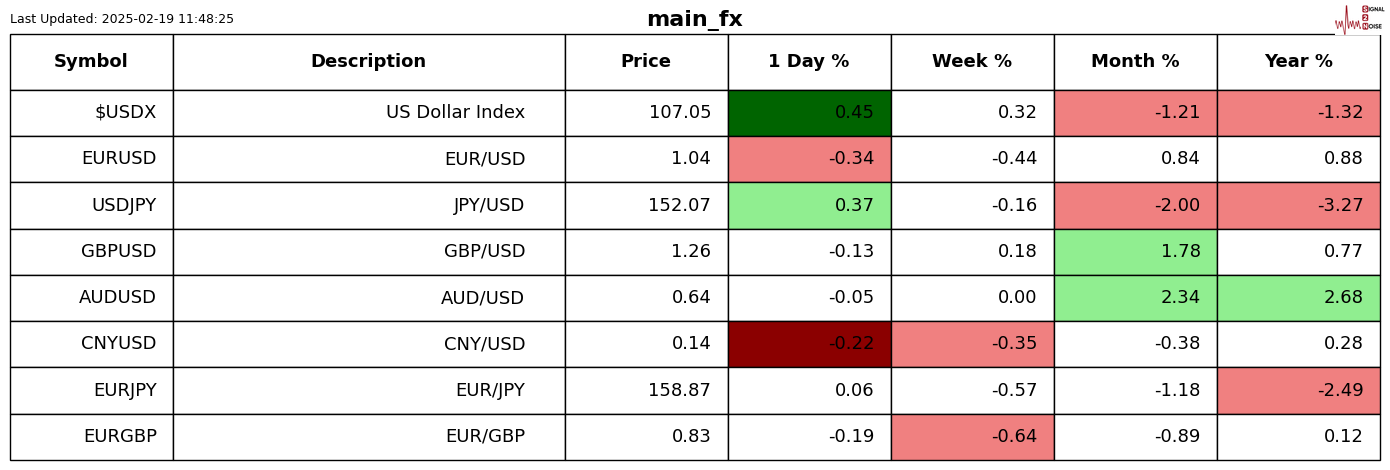
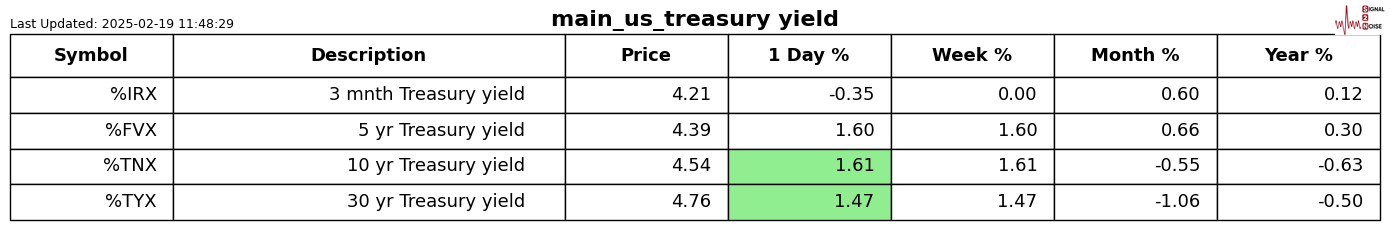
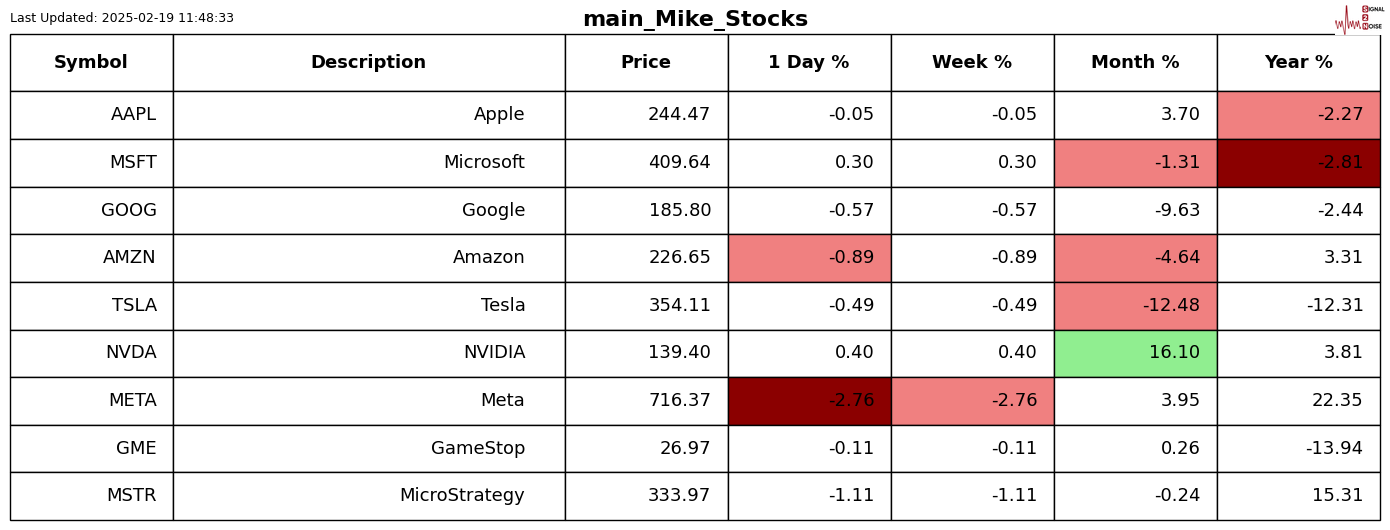
For those who are new to the letter, the shading is Z-Score adjusted so that only moves bigger than usual for the symbol are highlighted.
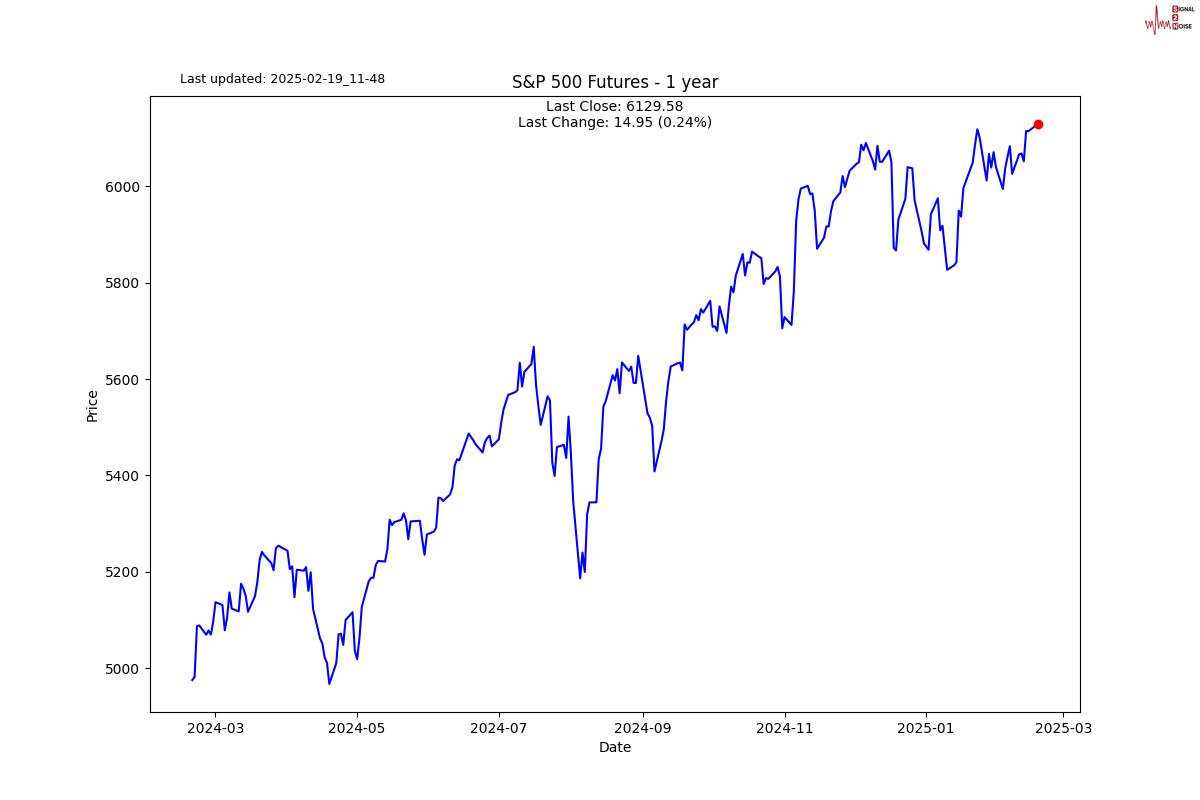
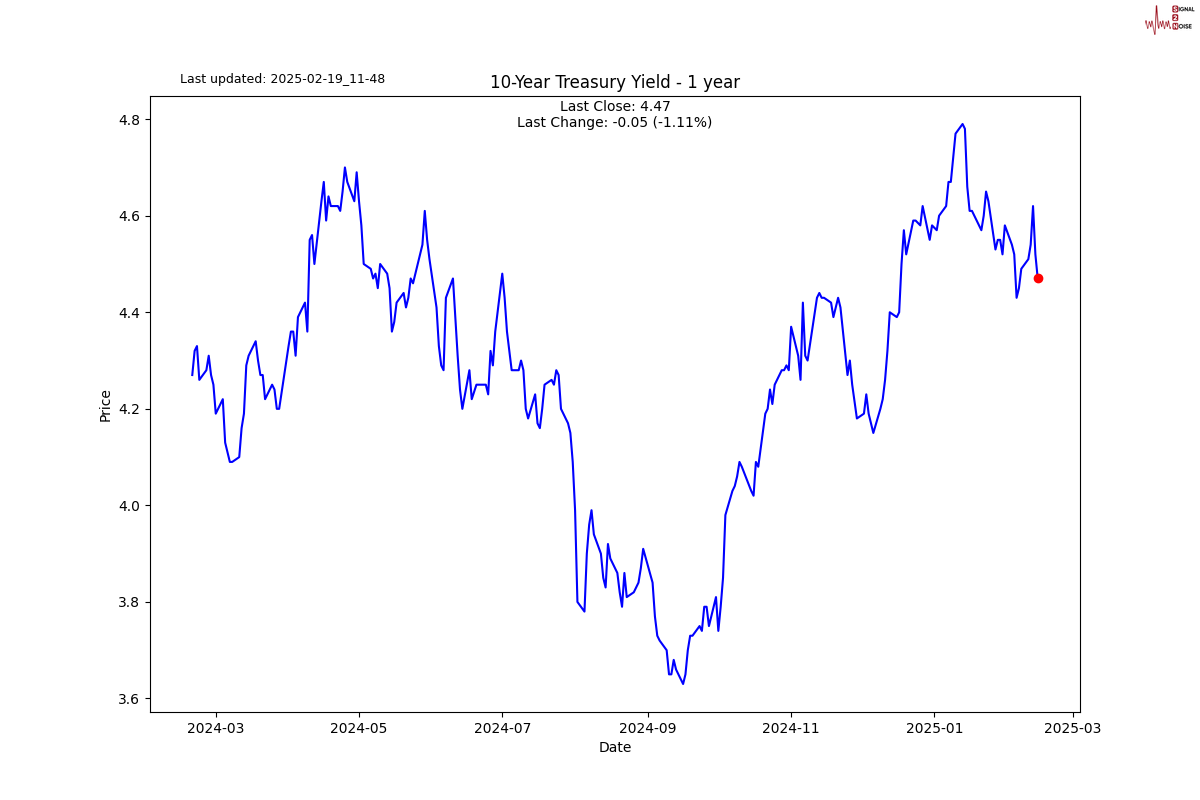
Chart gallery
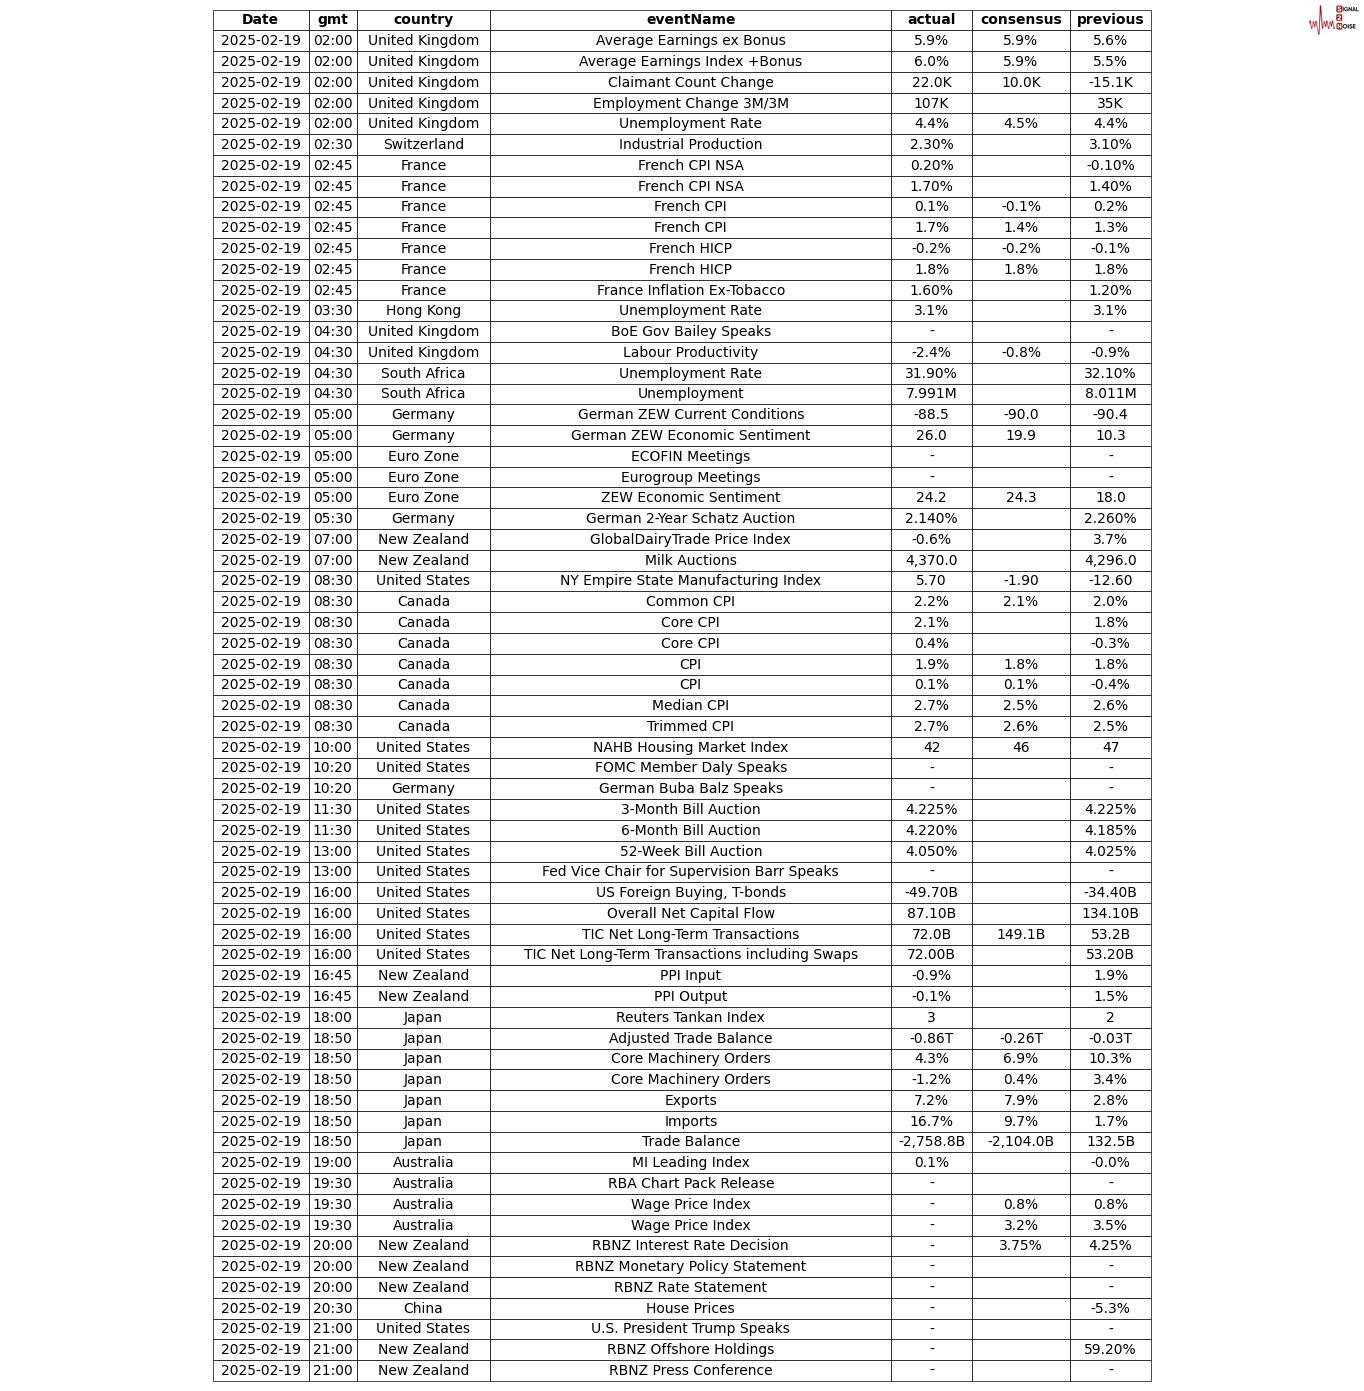
News today
Author

Michael Berman, PhD
Signal2Noise (S2N) News
Michael has decades of experience as a professional trader, hedge fund manager and incubator of emerging traders.


