The question today is how much will the Fed hike

US Dollar: Jun '23 USD is Down at 102.700.
Energies: May '23 Crude is Down at 69.05.
Financials: The Jun '23 30 Year T-Bond is UP 5 ticks and trading at 130.05.
Indices: The Mar '23 S&P 500 emini ES contract is 21 ticks Lower and trading at 4030.50.
Gold: The Apr'23 Gold contract is trading Up at 1947.70. Gold is 66 ticks Higher than its close.
Initial conclusion
This is not a correlated market. The dollar is Down, and Crude is Down which is not normal, and the 30 Year T-Bond is trading Higher. The Financials should always correlate with the US dollar such that if the dollar is Higher, then the bonds should follow and vice-versa. The S&P is Lower, and Crude is trading Lower which is not correlated. Gold is trading Higher which is correlated with the US dollar trading Down. I tend to believe that Gold has an inverse relationship with the US Dollar as when the US Dollar is down, Gold tends to rise in value and vice-versa. Think of it as a seesaw, when one is up the other should be down. I point this out to you to make you aware that when we don't have a correlated market, it means something is wrong. As traders you need to be aware of this and proceed with your eyes wide open. At the present time all of Asia is trading Higher. Currently all of Europe is trading Higher with the exception of the London exchange which is down fractionally.
Possible challenges to traders today
-
Crude Oil Inventories is out at 10:30 AM EST. This is Major.
-
FOMC Economic Projections is out at 2 PM EST. This is Major.
-
FOMC Statement is out at 2 PM EST. This is Major.
-
Federal Funds Rate is out at 2 PM EST. This is Major.
-
FOMC Press Conference starts at 2:30 PM EST. This is Major.
Treasuries
Traders, please note that we've changed the Bond instrument from the 30 year (ZB) to the 10 year (ZN). They work exactly the same.
We've elected to switch gears a bit and show correlation between the 10-year bond (ZN) and the S&P futures contract. The S&P contract is the Standard and Poor's, and the purpose is to show reverse correlation between the two instruments. Remember it's likened to a seesaw, when up goes up the other should go down and vice versa.
Yesterday the ZN hit a Low at around 10 AM EST. The S&P was trading Higher at around the same time. If you look at the charts below ZN gave a signal at around 10 AM and the S&P gave a signal at around the same time. Look at the charts below and you'll see a pattern for both assets. ZN hit a Low at around 10 AM and migrated Higher. These charts represent the newest version of MultiCharts and I've changed the timeframe to a 15-minute chart to display better. This represented a Long opportunity on the 10-year note, as a trader you could have netted about 30 ticks per contract on this trade. Each tick is worth $15.625. Please note: the front month for the ZN is now Jun '23. The S&P contract is also Jun' 23. I've changed the format to filled Candlesticks (not hollow) such that it may be more apparent and visible.
Charts courtesy of MultiCharts built on an AMP platform
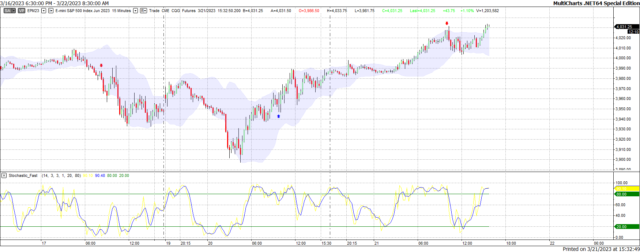
ZN - Jun 2023 - 3/21/23
-638150790189285919.png)
S&P - Jun 2023 - 3/21/23
Bias
Yesterday we gave the markets an Upside bias as the USD, Bonds and Gold were all trading Lower Tuesday morning and this is a good indication of an Upside Day. The markets didn't disappoint as the Dow traded 361 points Higher and the other indices traded Higher as well. Given that today is FOMC Day our bias is Neutral or Mixed. Why? Because the markets have never shown any sense of normalcy on this day.
Could this change? Of Course. Remember anything can happen in a volatile market.
Commentary
Yesterday when we arose and viewed the markets, it seemed to us that the markets would continue its Upward trend from Monday and go Higher. The markets didn't disappoint but it was correlated to the Upside even in the early AM hours. Do we think that the Fed will raise rates? Unfortunately, yes although we wish he wouldn't. Inflation is 6% Higher and the only way the Fed can chop it down to size is to raise rates, making it more difficult to borrow funds and slow down the economy. Unfortunately slowing down the economy means people will lose jobs and we've been saying tis for some time now. The question today is how much will the Fed hike? Will it be 25 basis points, 50 or greater? The Higher the amount they raise the more the markets will drop and then the question becomes for how long? Thus far this calendar year we've been dealing with an uncorrelated market, so are hoping it will be smaller. But as in all things, only time will tell.
Author

Nick Mastrandrea
Market Tea Leaves
Nick Mastrandrea over 20 years experience in trading and formerly held a NASD Series 7. He currently holds a NJ Life, Health and Variable Authority. Nick is a published writer and his work has appeared in Futures Magazine, TraderPlanet and others.


