The $QQQ Nasdaq tracker long term cycles and elliott wave

Firstly the QQQ instrument inception date was in March 1999. That was before it ended a larger cycle up from the all time lows in March 2000. The ETF instrument mirrors the price movement of the Nasdaq which did that. As shown below from the March 2000 highs the instrument experienced a steep correction lower in three swings to the October 2002 lows. From there to the October 2007 highs it ended the first of the current series of impulses in the blue color. This makes up the subdivisions of the wave ((III)) that has ended on February 19 2020. I have identified the next area for buyers in the current steep sell off.
As can be seen, the pullback from the October 2007 highs was in 3 swings that ended in November 2008. This corrected the cycle up from the October 2002 lows. The wave I was extended in the subdivision of wave (III). The wave II low created in August 2015 was strong enough to suggest it was correcting the cycle the November 2008 lows. Equally the same thought applies to the move up from there into the August 2018 wave (III) high.
Additionally it appeared the wave IV was only deep enough to be correcting the cycle from the August 2015 low. Afterward it saw another high in August 2018. The wave (IV) into the December 2018 lows was strong. It suggested it had corrected the cycle from the November 2008 low.
The analysis and commentary continues below the QQQ monthly chart
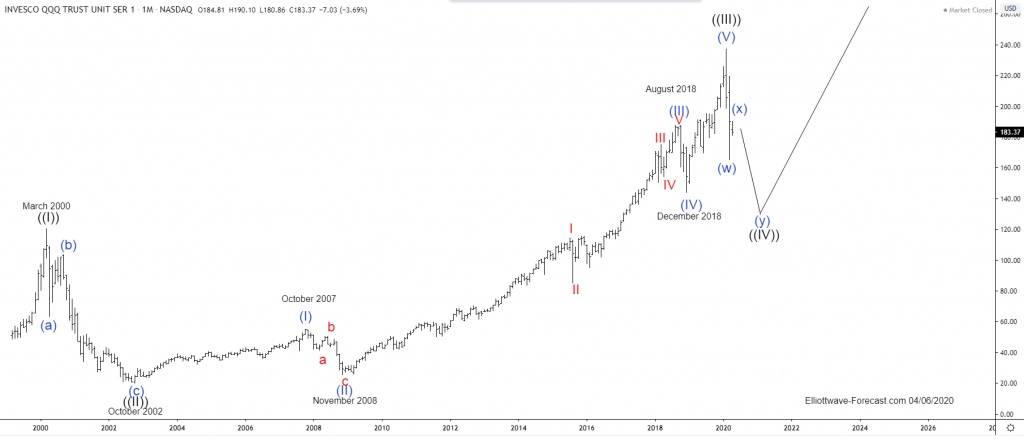
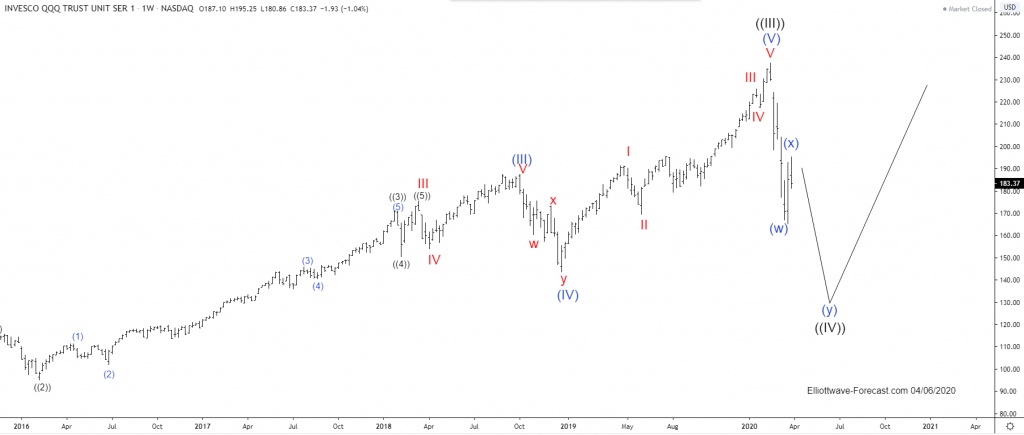
Secondly as previously suggested the QQQ instrument mirrors the Nasdaq highs & lows. As already mentioned, the cycle up from the October 2002 lows ended February 19 2020. It is now correcting the cycle up from the October 2002 lows. As known, impulses progress in 5-9 & 13 swings. Corrections against the trend proceed in 3-7 or 11 swings. This current correction is three swings so far however believe there will be three more.
The analysis and conclusion continues below the QQQ weekly and daily chart
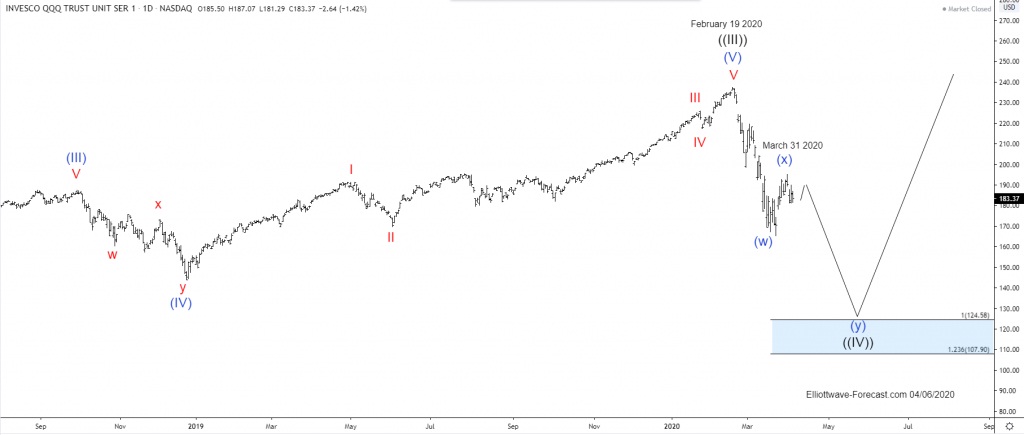
In conclusion the instrument can see a pullback lower of the same magnitude as like in the March 2000 highs to October 2002 lows in the current wave ((IV)) before turning higher again. Although steep this is a three swing pullback correction that has already seen 3 swings lower. It should see three more. As can be seen, the 124.58-107.90 area shown on the daily chart can be reached. This is provided the condition of price remaining below the March 31 2020 highs. Price back above there would suggest it still remained in the blue wave (x) and after completing 3 more swings higher it would require the buying extension area be remeasured.
Author

Elliott Wave Forecast Team
ElliottWave-Forecast.com


