The price of Gold is still near its 2011 high

Between 2020 and now, quite a lot happened, quite a lot of money was printed, and we saw a war breaking out in Europe. Yet gold failed to rally to new highs.
In fact, it’s trading very close to its 2011 high, which tells you something about the strength of this market. It’s almost absent.
2011 High... And?
Truth be told, what we see in gold is quite in tune with what we saw after the 2011 top, and in particular, shortly after the 2012 top. We can also spot similarities between now and 2008. The long-term gold price chart below provides details.
Actually, since the gold price is still trading close to its 2011 high, my previous description of the below gold chart remains up-to-date:
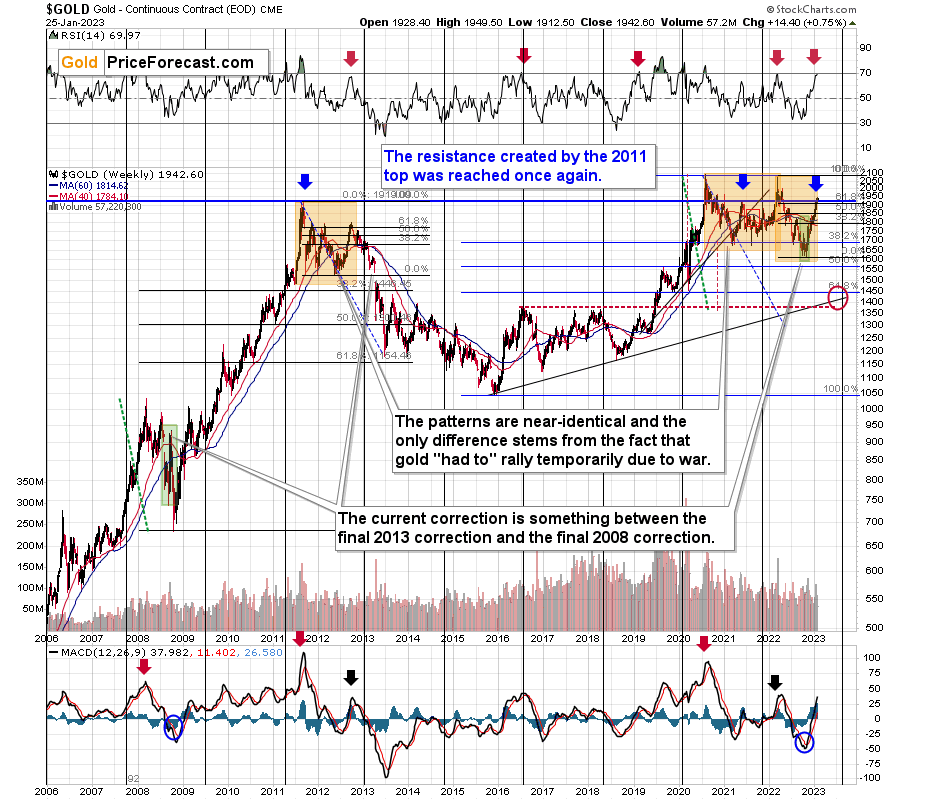
Do you know what levels gold has recently reached? Hint: those are very, very, very important price levels…
Gold just once again reached its 2011 high.
The one that triggered reversals either immediately or after an additional rally (but it took a war outbreak in Europe to push gold temporarily (!) above this level). Therefore, the importance of this long-term resistance can’t be overstated.
That’s one thing. Another thing is that, given the major fundamental event that I already mentioned above (the war outbreak), it’s possible for the technical patterns to be prolonged and perhaps even repeated before the key consequence materialized. Similarly to the head-and-shoulders pattern that can have more than one right head before the breakdown and slide happen.
In gold’s case, this could mean that due to the post-invasion top, the entire 2011-2013-like pattern got two major highs instead of one. And thus, the initial decline and the subsequent correction are pretty much a repeat of what we saw in 2020 and early 2021, as well as what we saw in 2011 and 2012.
The particularly interesting fact (!) about the correction that we saw after the 2011-2012 decline (the one that was followed by the huge 2012-2013 decline) is that during it, gold corrected slightly more than 61.8% of the preceding medium-term decline. Consequently, the current situation is just like what happened back then.
If all the above wasn’t bearish enough, please take a look at the reading of the RSI indicator based on the weekly price changes. It’s now just below 70, and guess where it was at the final top before the 2012-2013 slide? Yes, it was exactly there, too.
That’s also approximately where the RSI was at last year’s top.
The orange rectangles on the above chart represent the corrective upswings from approximately the previous local lows. There are two of them, and back in 2013, there was just one corrective upswing before gold truly plunged.
Gold vs. Fibonacci Retracement
However, please remember that history doesn’t repeat itself to the letter – it rhymes. This means that two corrections instead of one are still within the scope of the similarity, especially since the first correction wasn’t as big as the 2008 one.
The current situation is truly special, as the rate hikes are something that we haven’t seen in a long time. The same goes for the level of concern about the inflation that’s “out there.” The latter implies that when faced with a decision about whether to fight inflation or help the economy, the Fed is likely to lean toward the former, and that’s bearish for assets like gold.
Looking at gold from a short-term point of view, we see that it has indeed moved above the 61.8% Fibonacci retracement.
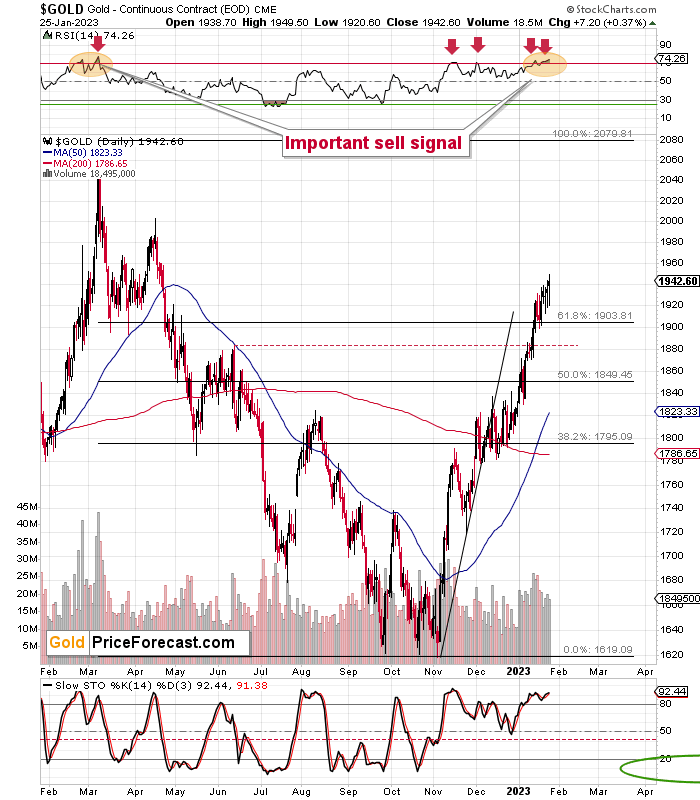
This would have been a bullish indication if it weren’t for the very bearish analogy to late 2012.
Particularly given that gold's RSI based on weekly closing prices is just below 70 and the RSI based on daily prices is well above 70. In fact, gold’s daily RSI is above 70 for the second time in a relatively short period, and that’s exactly what we also saw at the 2022 top.
Remember the feeling that was prevalent among gold investors and traders at the 2022 top, when it was trading above $2,000? The overwhelming bullishness? The feeling of invincibility? All the theories due to which gold just has to rally? It’s quite similar right now.
These are emotions that accompany tops, whereas fear, disappointment, and despair accompany bottoms. It’s much easier to describe ignoring emotions in trading than to actually do it, but it’s my responsibility to remind you how it is, how it was, and what happened to the price of gold during similar times.
And it fell. Hard.
Let’s zoom even further.
On the chart below (courtesy of https://www.goldpriceforecast.com/), you can see that while gold made another intraday attempt to move above the recent short-term highs and the silver price tried to once again move above $24, both moves failed.
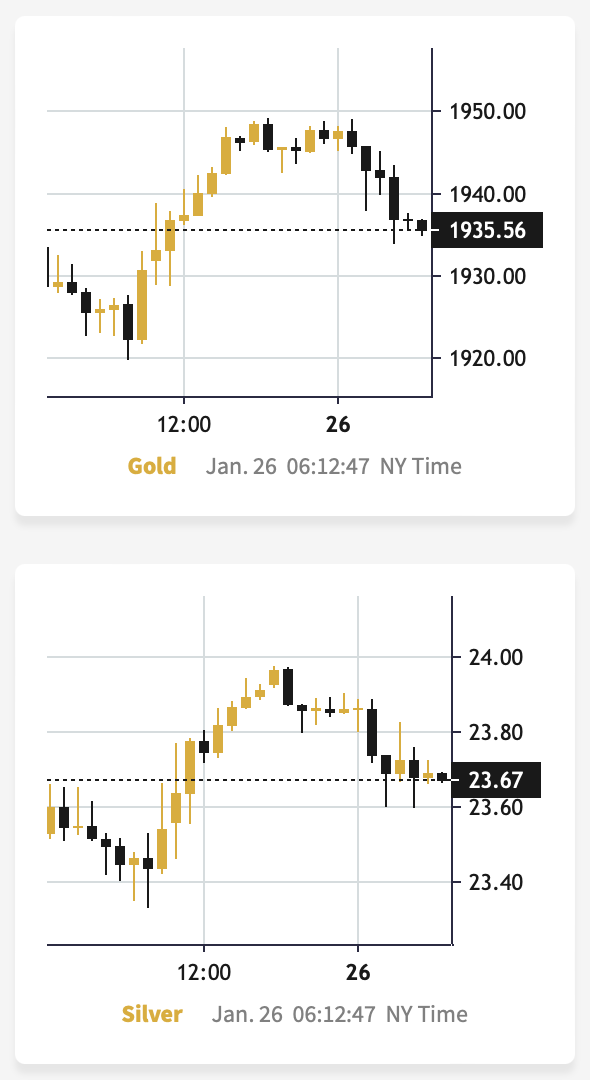
This indicates that the rally’s days are likely numbered.
Of course, we might get another intraday or intraweek attempt to move higher – just like we saw those attempts in the previous days. However, given the long-term resistance that I described earlier today, it’s likely that the next big, meaningful move will be to the downside.
Naturally, the above is up-to-date at the moment when it was written. When the outlook changes, I’ll provide an update. If you’d like to read it as well as other exclusive gold and silver price analyses, I encourage you to sign up for our free gold newsletter.
Want free follow-ups to the above article and details not available to 99%+ investors? Sign up to our free newsletter today!
Author

Przemyslaw Radomski, CFA
Gold Price Forecast
Przemyslaw Radomski, CFA (PR) is a precious metals investor and analyst who takes advantage of the emotionality on the markets, and invites you to do the same. His company, Sunshine Profits, publishes analytical software that any


