The Pound faces challenges: Weak data and external pressures mount

The GBP/USD pair is trading near 1.3445 on Wednesday, with the pound closing September with its first monthly decline against the US dollar since July.
Short-term price action remains under pressure from the looming US government shutdown, which threatens to delay the release of key US macroeconomic data, injecting uncertainty into the market.
Domestic economic figures from the UK offered a mixed picture. Second-quarter GDP growth was confirmed at 0.3% quarter-on-quarter, matching forecasts. However, the current account deficit widened significantly to £28.9 billion, or 3.8% of GDP, up from 2.8% in the previous quarter and well beyond expectations.
The pound is also contending with substantial domestic headwinds. The UK continues to grapple with the highest inflation rate among major developed economies (around 4%) and elevated borrowing costs. Bank of England Deputy Governor Sarah Breeden emphasised that inflation remains excessively high, noting two-sided risks. She warned that prices for food and services could keep inflation stubbornly elevated, despite emerging signs of a slowdown in wage growth.
Further pressure stems from fiscal policy, with Chancellor of the Exchequer Rachel Reeves preparing the budget for 26th November. Tax rises are seen as almost inevitable to cover a fiscal gap estimated in the tens of billions of pounds.
In summary, the pound is caught between external risks—such as the US shutdown and global capital flows—and domestic challenges, including a high deficit, persistent inflation, and the prospect of fiscal tightening.
Technical analysis: GBP/USD
H4 Chart:
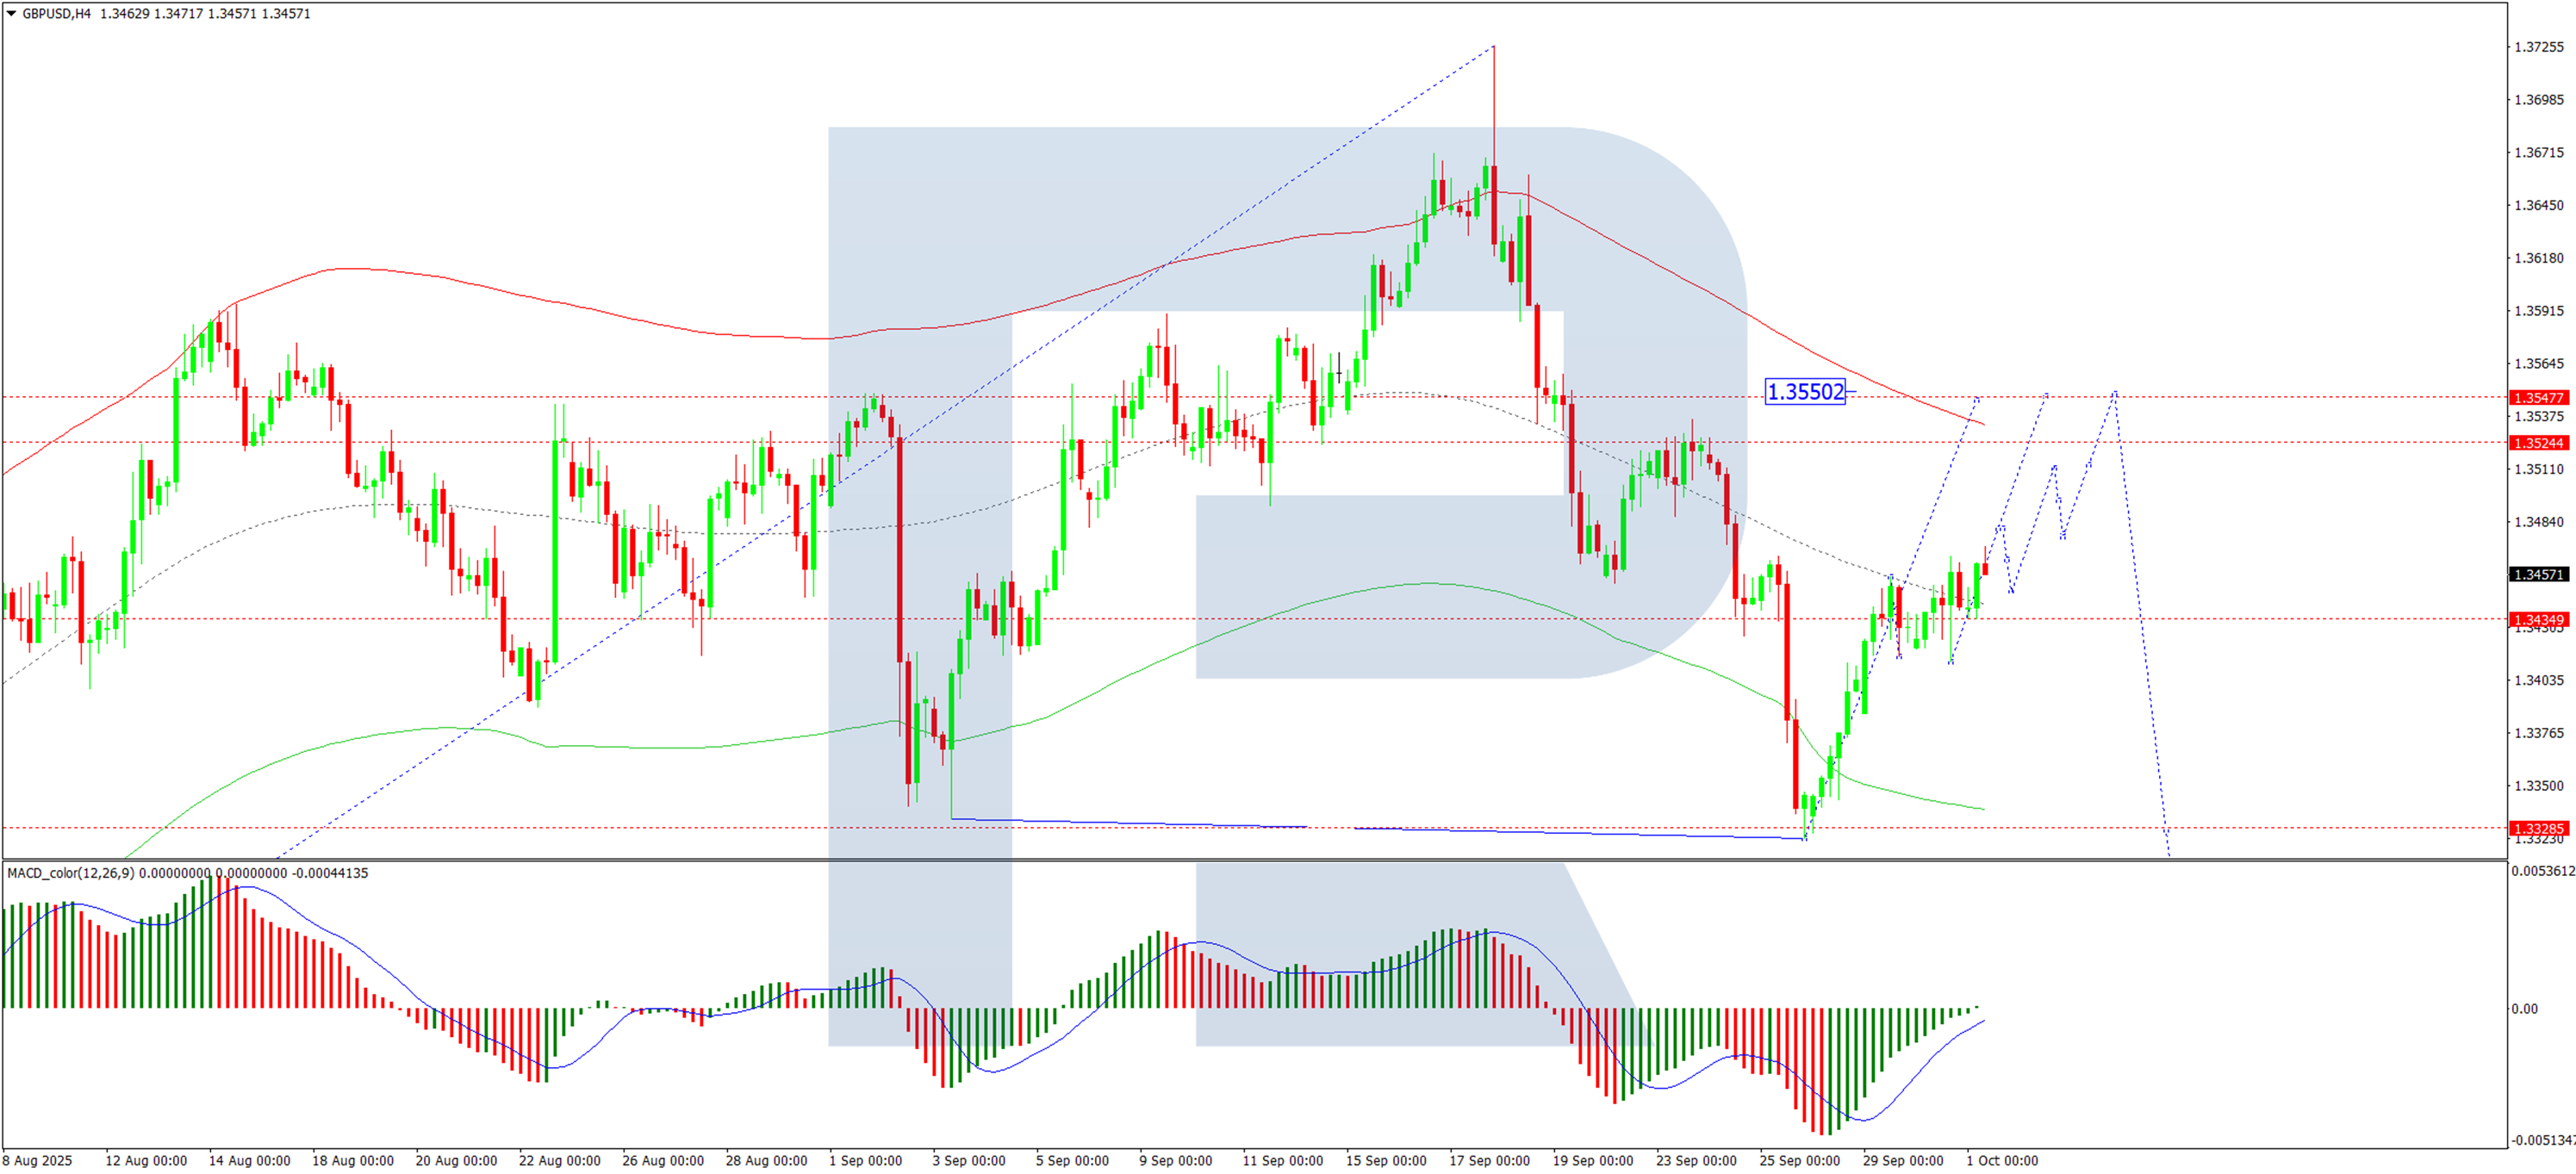
On the H4 chart, GBP/USD formed a tight consolidation range around 1.3434. Following an upward breakout, the pair is now developing a corrective wave towards 1.3550. Once this correction is complete, we anticipate the start of a new decline towards 1.3434, with a longer-term prospect of extending the downtrend to 1.3330. This outlook is technically confirmed by the MACD indicator, whose signal line is below zero but is rising steadily.
H1 Chart:
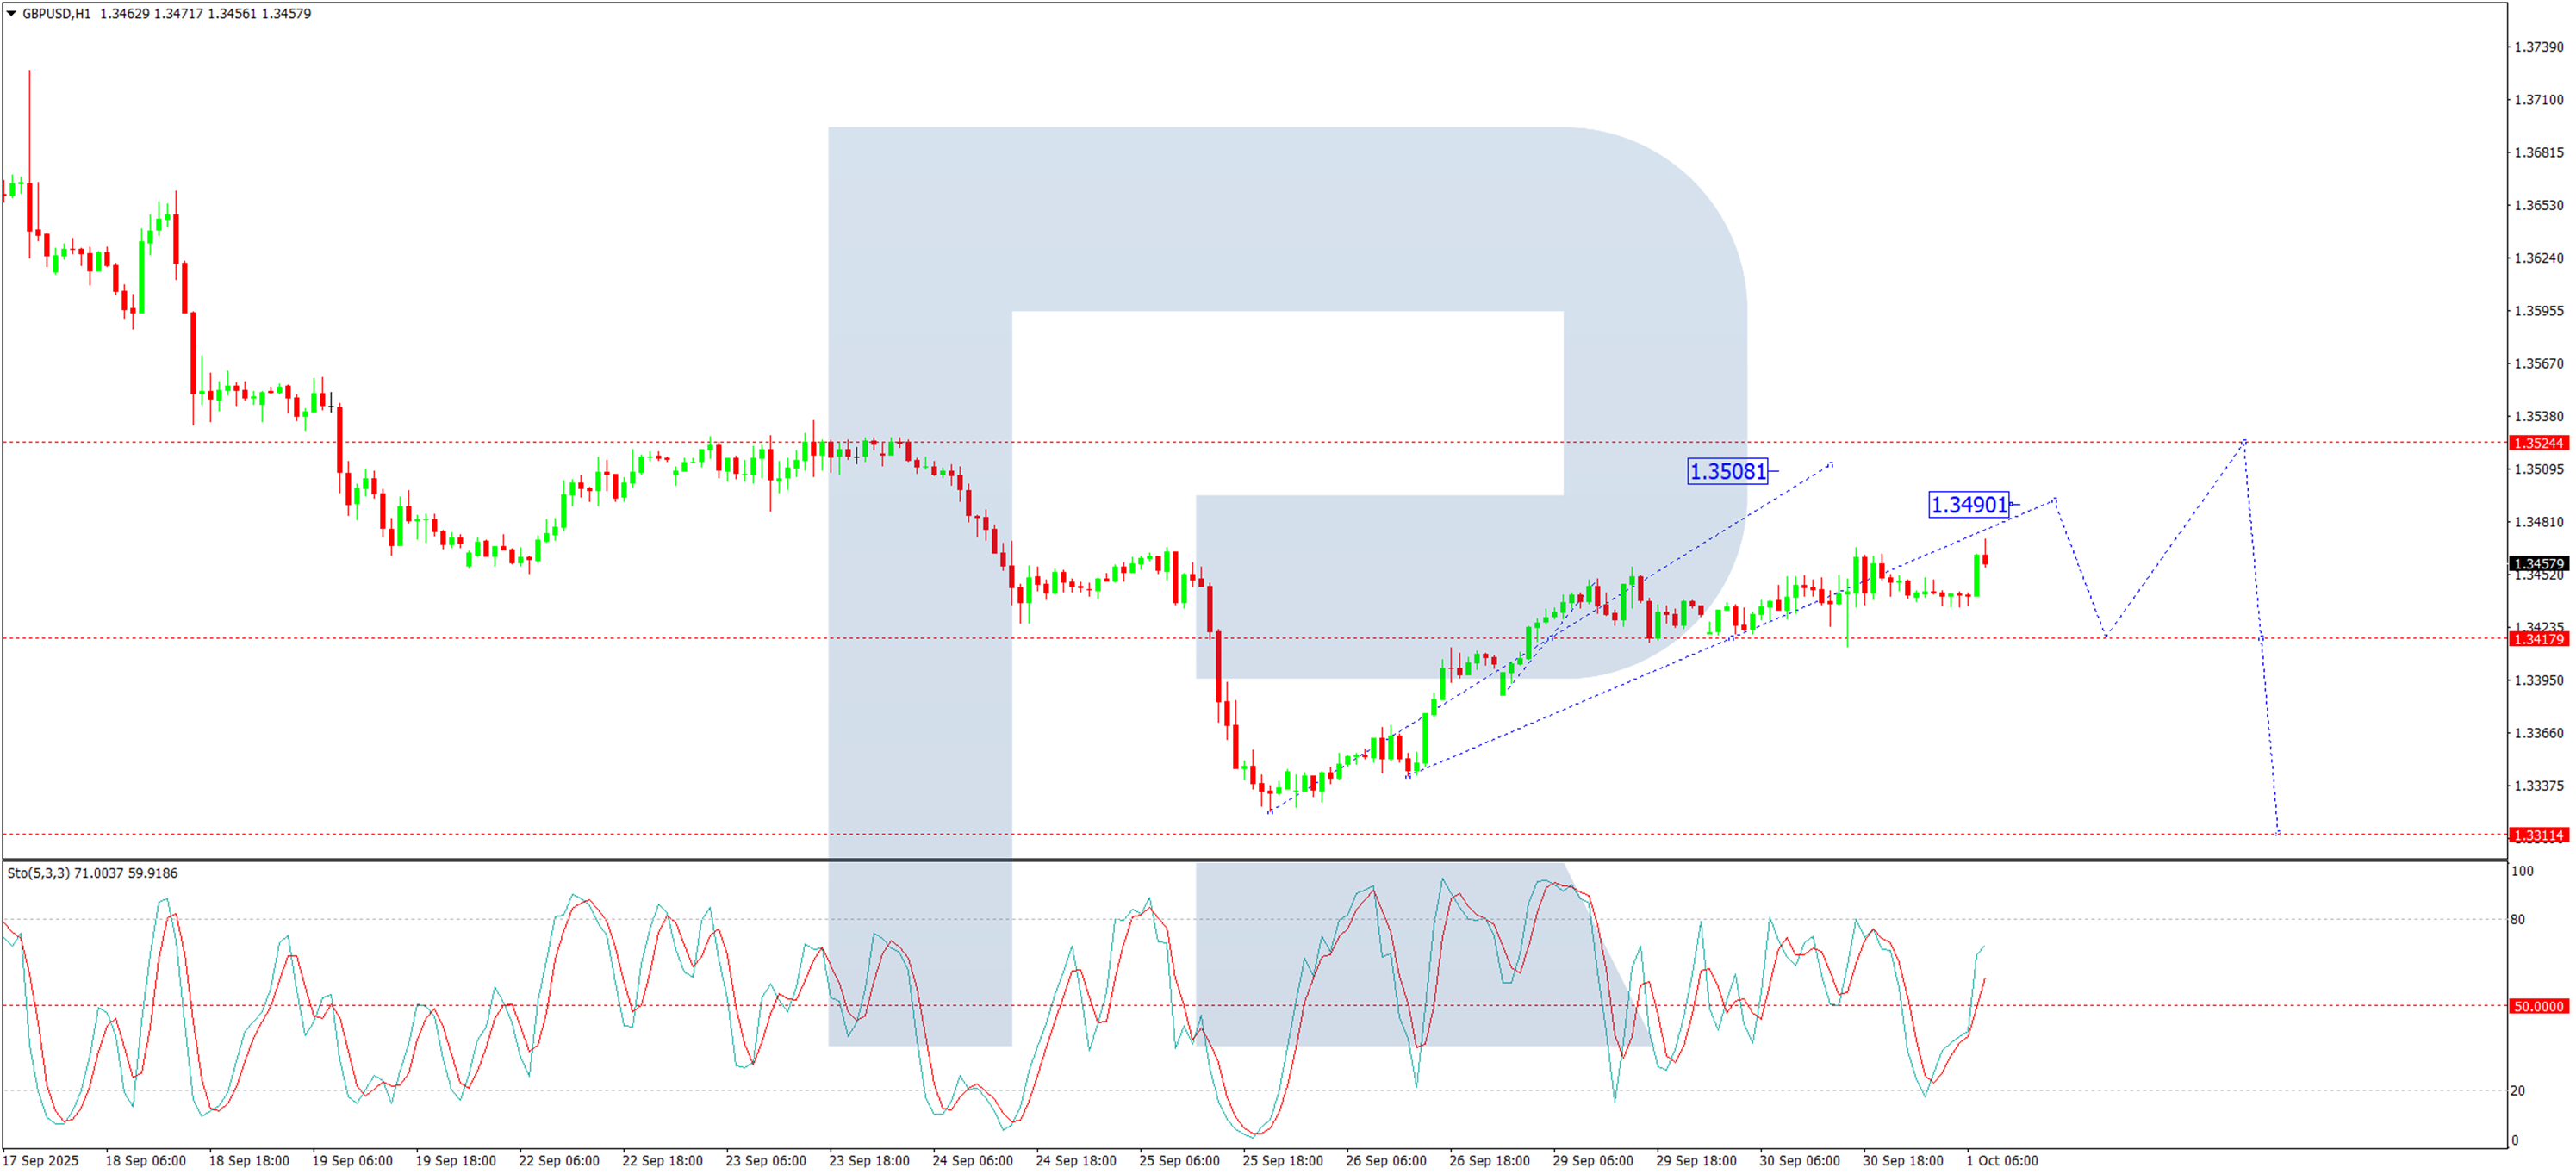
The H1 chart shows the pair forming a consolidation range around 1.3418 before breaking upwards. It is now continuing a growth wave towards a local target of 1.3490. Following this, a decline back to 1.3418 (testing it as support from above) is expected. Subsequently, another upward structure could develop, targeting at least 1.3508, with a potential extension to 1.3550. The Stochastic oscillator supports this view, with its signal line above 50 and rising sharply towards 80.
Conclusion
The pound is navigating a complex landscape of domestic economic weaknesses and external uncertainties. While a short-term technical correction is underway, the broader fundamental and technical picture suggests the downward trajectory is likely to resume after the current upward move is exhausted.
Author

RoboForex Analysis Department
RoboForex
RoboForex Analysis Department provides timely market insights, expert technical analysis, and actionable forecasts across forex, commodities, indices, and equities.