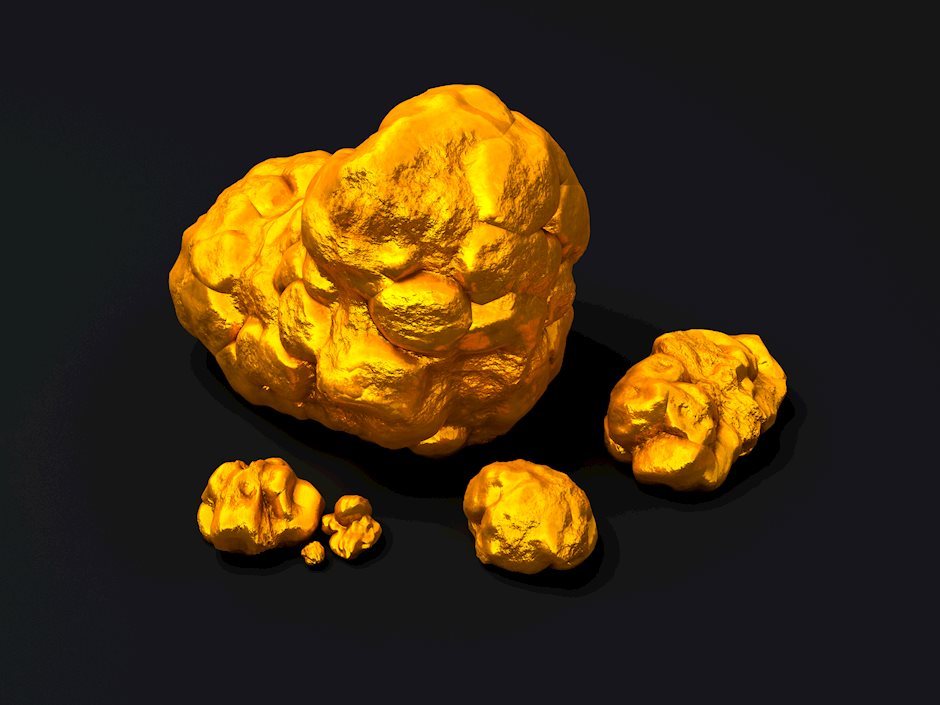
The monthly: Gold is going higher, much higher

EUR/USD
The advance and close on May 28 completed an 11-week symmetrical triangle, launched by an imbedded 8-week inverted H&S construction. The targets are 1.1257 and 1.1598. The set-up will be negated by a close below 1.0870.
Markets on the radar screen as previously issued or pending Special Situation Reports (SSRs):
U.S Treasuries
The 5-Yr and 10-Yr T-Notes are forming continuation ascending triangles (a Cup and Handle labeling is also appropriate).
Crown Castle International (CCI)
This stock has experienced a spectacular bull trend for many years. The daily and weekly charts display a 14-week Cup and Handle pattern, arguably completed on May 29. One more higher close will confirm this bullish chart construct. Longs in this stock could be defended below the May 21 low of 148.38, the May 27 low of 158.09 or in relationship to the 18 DMA.
Canadian Dollar – SSR Pending
I continue to believe that the 4+ year H&S pattern on the monthly weekly chart is a valid interpretation. The market could simply be in the process of retesting the neckline of the H&S pattern at .7330. I will be monitoring the daily chart for an indication that the rally is complete, and will issue a SSR accordingly. One possibility is that a decline below .7072 would be an “end-around” the symmetrical triangle.
Gold – SSR Pending
Ugh! I feel like I have been in the spin cycle with this market. The breakout of the massive inverted H&S bottom on the monthly chart was an easy trade. In fact, Gold was a wonderful example of classical charting principles until the COVID-19 decline in Mar. Gold has been a difficult trade since.
I continue to believe Gold is going higher – much higher. Yet, I feel a little snake-bitten by the market. The daily chart of the Aug contract displays a possible ascending triangle. The Real Range chart displays a continuation rectangle pattern in greater clarity, whereby a decisive close (25% to 50% of ATR) above 1772 would be a buy signal. Most impressive to me is the steady uptrend in spot (physical) Gold.
Other Charts of Interest (as of this date) that might offer swing trading opportunities Corn
Strong historical support on the monthly graph, which also displays a 6-year rectangle. There is near-record commercial long positioning. A symmetrical triangle has formed in the Dec contract.
Author

Peter L. Brandt
Factor LLC
Peter Brandt is the founder and CEO of Factor LLC, a proprietary trading firm founded in 1981 at the Chicago Board of Trade.
-637290965160248244.png&w=1536&q=95)
-637290965831051526.png&w=1536&q=95)
-637290966198875711.png&w=1536&q=95)
-637290966600303172.png&w=1536&q=95)
-637290960840343617.png&w=1536&q=95)
-637290961232551312.png&w=1536&q=95)
-637290961416150345.png&w=1536&q=95)
-637290961978200737.png&w=1536&q=95)
-637290962147746505.png&w=1536&q=95)
-637290962341674474.png&w=1536&q=95)
-637290962492148706.png&w=1536&q=95)
-637290963198889343.png&w=1536&q=95)
-637290963442850092.png&w=1536&q=95)


