The Markets Strike Back [Video]
![The Markets Strike Back [Video]](https://editorial.fxstreet.com/images/Markets/Currencies/coins-from-around-the-world-56901212_XtraLarge.jpg)
US Dollar: Sept USD is Up at 97.470.
Energies: Sept '19 Crude is Down at 53.51.
Financials: The Sept 30 year bond is Up 39 ticks and trading at 162.07.
Indices: The Sept S&P 500 emini ES contract is 34 ticks Higher and trading at 2884.50.
Gold: The Dec Gold contract is trading Up at 1498.40 Gold is 140 ticks Higher than its close.
Initial Conclusion
This is not a correlated market. The dollar is Up+ and Crude is Down- which is normal and the 30 year Bond is trading Higher. The Financials should always correlate with the US dollar such that if the dollar is lower then bonds should follow and vice-versa. The S&P is Higher and Crude is trading Higher which is not correlated. Gold is trading Higher which is not correlated with the US dollar trading Up. I tend to believe that Gold has an inverse relationship with the US Dollar as when the US Dollar is down, Gold tends to rise in value and vice-versa. Think of it as a seesaw, when one is up the other should be down. I point this out to you to make you aware that when we don't have a correlated market, it means something is wrong. As traders you need to be aware of this and proceed with your eyes wide open.
Currently Asia is trading Mixed. At this time all of Europe is trading to the Upside.
Possible Challenges To Traders Today
-
FOMC Member Evans Speaks at 9:30 AM EST. This is major
-
Crude Oil Inventories is out at 10:30 AM EST. This is major.
-
10-y Bond Auction starts at 1PM EST. This is major.
-
Consumer Credit m/m is out at 3 PM EST. This is major.
Treasuries
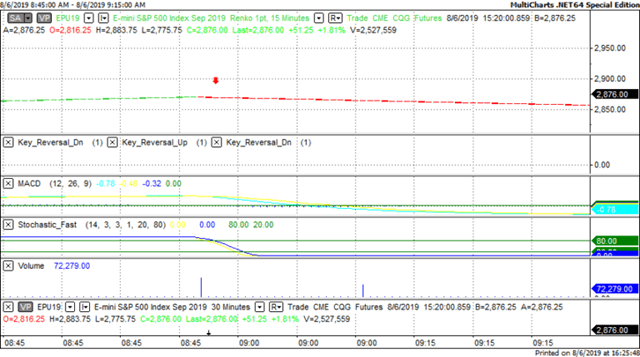
We've elected to switch gears a bit and show correlation between the 30 year bond (ZB) and The YM futures contract. The YM contract is the DJIA and the purpose is to show reverse correlation between the two instruments. Remember it's liken to a seesaw, when up goes up the other should go down and vice versa.
Yesterday the ZB made a major move at around 9 AM EST. The ZB hit a Low at around that time and the YM hit a High. If you look at the charts below ZB gave a signal at around 9 AM EST and the YM was moving Lower at the same time. Look at the charts below and you'll see a pattern for both assets. ZB hit a Low at around 9 AM and the YM was moving Lower at the same time. These charts represent the newest version of MultiCharts and I've changed the timeframe to a 15 minute chart to display better. This represented a Long opportunity on the 30 year bond, as a trader you could have netted about 25 plus ticks per contract on this trade. Each tick is worth $31.25. Please note: the front month for both the ZB and YM contract is now September, 2019 and I've changed the format to Renko bars such that it may be more apparent and visible.
Charts Courtesy of MultiCharts built on an AMP platform Click on an image to enlarge it.
Bias
Yesterday we gave the markets an Upside bias as the USD, Bonds and Gold were trading Lower and this does bode well for an upside day. The markets didn't disappoint as the Dow gained 312 points and the other indices gained ground as well. Today we aren't dealing with a correlated market and our bias is to the Neutral.
Could this change? Of Course. Remember anything can happen in a volatile market.
Commentary
Yesterday we witnessed the equivalent of what has been known as a dead cat bounce. This is where the markets fall dramatically but then rebound, not necessarily to the levels that they once were but Higher nonetheless. Do we think that the markets will return to the levels they once were? We think they're going to want to get as close to it as possible.
Author

Nick Mastrandrea
Market Tea Leaves


