Good Morning Traders,

As of this writing 4:20 AM EST, here’s what we see:

US Dollar: Dec. USD is Up at 94.925.
Energies: Nov '18 Crude is Up at 71.45.
Financials: The Dec 30 year bond is Down 9 ticks and trading at 138.14.
Indices: The Dec S&P 500 emini ES contract is 49 ticks Lower and trading at 2756.00.
Gold: The Dec Gold contract is trading Up+ at 1231.20. Gold is 91 ticks Higher than its close.

Initial Conclusion

This is not a correlated market. The dollar is Up+ and Crude is Up+ which is not normal and the 30 year Bond is trading Lower. The Financials should always correlate with the US dollar such that if the dollar is lower then bonds should follow and vice-versa. The S&P is Lower and Crude is trading Higher which is correlated. Gold is trading Up+ which is not correlated with the US dollar trading Higher. I tend to believe that Gold has an inverse relationship with the US Dollar as when the US Dollar is down, Gold tends to rise in value and vice-versa. Think of it as a seesaw, when one is up the other should be down. I point this out to you to make you aware that when we don't have a correlated market, it means something is wrong. As traders you need to be aware of this and proceed with your eyes wide open.

At this hour all of Asia is trading to the Downside with the exception of the Indian Sensex which is Higher. Currently all of Europe is trading Lower with the exception of the Milan exchange which is Higher at this time.

Possible Challenges To Traders Today

  • Retail Sales is out at 8:30 AM EST. This is major.

  • Core Retail Sales is out at 8:30 AM EST. This is major.

  • Empire State Mfg Index is out at 8:30 AM. This is major.

  • Business Inventories is out at 10 AM EST. This is major.

  • Federal Budget Balance is out. This is Major.

  • Treasury Currency Report is out. This is Major.

 Treasuries

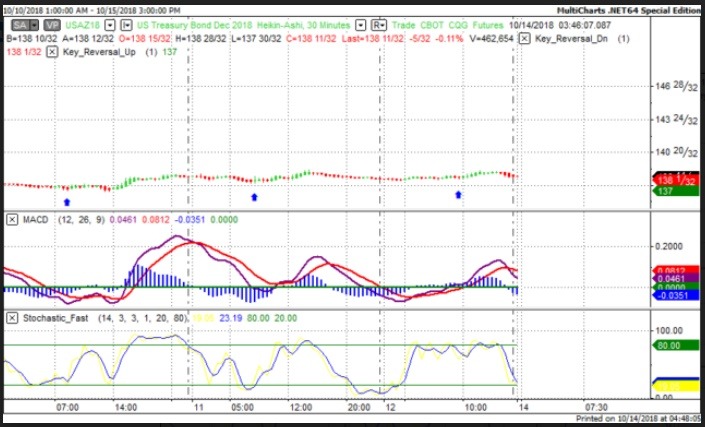
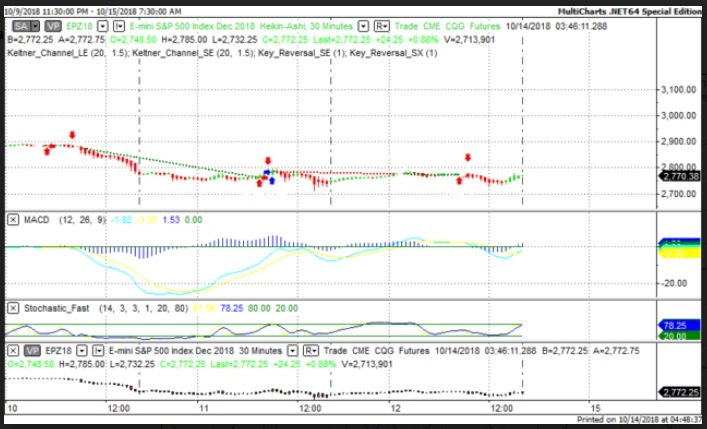
We've elected to switch gears a bit and show correlation between the 30 year bond (ZB) and The YM futures contract. The YM contract is the DJIA and the purpose is to show reverse correlation between the two instruments. Remember it's liken to a seesaw, when up goes up the other should go down and vice versa.

On Friday the ZB made it's move at around 9:30 AM EST. The ZB hit a Low at around that time and the YM hit a High. If you look at the charts below ZB gave a signal at around 9:30 AM EST and the YM was moving Lower at the same time. Look at the charts below and you'll see a pattern for both assets. ZB hit a Low at around 9:30 AM and the YM was moving Lower at the same time. These charts represent the newest version of MultiCharts and I've changed the timeframe to a 30 minute chart to display better. This represented a Long opportunity on the 30 year bond, as a trader you could have netted about 20 ticks per contract on this trade. Each tick is worth $31.25.

Charts Courtesy of MultiCharts built on an AMP platform.

Correlation

Correlation

Bias

On Friday we gave the markets an Upside bias and the markets didn't disappoint. The Dow gained 287 points and the other indices gained ground as well. Today we aren't dealing with a correlated market and our bias is to the Downside.

Could this change? Of Course. Remember anything can happen in a volatile market.

Commentary

This past week we witnessed enormous volatility the like of which we have not seen since the Great Recession started back in 2008. There was no particular reason as to why this occurred. We can't point to any one event that made this happen. As such it can only the the work of the Smart Money in action. Back in 2008-2009 we used to talk about the PPT (Plunge Protection Team). At that time it was very interesting to see that after the 9:30 Opening Bell rang the ES contract would either go immediately up or down. This can only be achieved by institutions that have the capital to do so and when they trade, they don't trade with one or two contracts. They use tens of thousands.

Trading performance displayed herein is hypothetical. The following Commodity Futures Trading Commission (CFTC) disclaimer should be noted.

Hypothetical performance results have many inherent limitations, some of which are described below. No representation is being made that any account will or is likely to achieve profits or losses similar to those shown.

In fact, there are frequently sharp differences between hypothetical performance results and the actual results subsequently achieved by any particular trading program. One of the limitations of hypothetical performance trading results is that they are generally prepared with the benefit of hindsight.

In addition, hypothetical trading does not involve financial risk, and no hypothetical trading record can completely account for the impact of financial risk in actual trading. For example, the ability to withstand losses or to adhere to a particular trading program in spite of trading losses are material points which can also adversely affect actual trading results.

There are numerous other factors related to the markets in general or to the implementation of any specific trading program which cannot be fully accounted for in the preparation of hypothetical performance results and all of which can adversely affect actual trading results.

Trading in the commodities markets involves substantial risk and YOU CAN LOSE A LOT OF MONEY, and thus is not appropriate for everyone. You should carefully consider your financial condition before trading in these markets, and only risk capital should be used.

In addition, these markets are often liquid, making it difficult to execute orders at desired prices. Also, during periods of extreme volatility, trading in these markets may be halted due to so-called “circuit breakers” put in place by the CME to alleviate such volatility. In the event of a trading halt, it may be difficult or impossible to exit a losing position.

Recommended Content


Recommended Content

Editors’ Picks

AUD/USD stands firm above 0.6500 with markets bracing for Aussie PPI, US inflation

AUD/USD stands firm above 0.6500 with markets bracing for Aussie PPI, US inflation

The Aussie Dollar begins Friday’s Asian session on the right foot against the Greenback after posting gains of 0.33% on Thursday. The AUD/USD advance was sponsored by a United States report showing the economy is growing below estimates while inflation picked up. The pair traded at 0.6518.

AUD/USD News

EUR/USD mired near 1.0730 after choppy Thursday market session

EUR/USD mired near 1.0730 after choppy Thursday market session

EUR/USD whipsawed somewhat on Thursday, and the pair is heading into Friday's early session near 1.0730 after a back-and-forth session and complicated US data that vexed rate cut hopes.

EUR/USD News

Gold soars as US economic woes and inflation fears grip investors

Gold soars as US economic woes and inflation fears grip investors

Gold prices advanced modestly during Thursday’s North American session, gaining more than 0.5% following the release of crucial economic data from the United States. GDP figures for the first quarter of 2024 missed estimates, increasing speculation that the US Fed could lower borrowing costs.

Gold News

Bitcoin price continues to get rejected from $65K resistance as SEC delays decision on spot BTC ETF options

Bitcoin price continues to get rejected from $65K resistance as SEC delays decision on spot BTC ETF options

Bitcoin (BTC) price has markets in disarray, provoking a broader market crash as it slumped to the $62,000 range on Thursday. Meanwhile, reverberations from spot BTC exchange-traded funds (ETFs) continue to influence the market.

Read more

Bank of Japan expected to keep interest rates on hold after landmark hike

Bank of Japan expected to keep interest rates on hold after landmark hike

The Bank of Japan is set to leave its short-term rate target unchanged in the range between 0% and 0.1% on Friday, following the conclusion of its two-day monetary policy review meeting for April. The BoJ will announce its decision on Friday at around 3:00 GMT.

Read more

Majors

Cryptocurrencies

Signatures