The Markets Strike Back

Good Morning Traders,
As of this writing 3:15 AM EST, here’s what we see:
US Dollar: Sept. USD is Down at 95.480.
Energies: Aug Crude is Down at 45.09.
Financials: The Sept 30 year bond is Down 14 ticks and trading at 154.18.
Indices: The Sept S&P 500 emini ES contract is 29 ticks Higher and trading at 2444.25.
Gold: The Aug gold contract is trading Up at 1251.00. Gold is 19 ticks Higher than its close.
Initial Conclusion
This is not a correlated market. The dollar is Down- and Crude is Up+ which is normal and the 30 year Bond is trading Lower. The Financials should always correlate with the US dollar such that if the dollar is lower then bonds should follow and vice-versa. The indices are Up+ and Crude is trading Up+ which is not correlated. Gold is trading Up+ which is correlated with the US dollar trading Down-. I tend to believe that Gold has an inverse relationship with the US Dollar as when the US Dollar is down, Gold tends to rise in value and vice-versa. Think of it as a seesaw, when one is up the other should be down. I point this out to you to make you aware that when we don’t have a correlated market, it means something is wrong. As traders you need to be aware of this and proceed with your eyes wide open.
At this hour all of Asia is trading Higher. All of Europe is trading Higher at this hour as well.
Possible Challenges To Traders Today
– Unemployment Claims are out at 8:30 AM EST. This is major.
– Final GDP q/q is out at 8:30 AM EST. This is major.
– Final GDP Price Index q/q is out at 8:30 AM EST. This is major.
– Nat Gas Inventories are out at 10:30 AM EST. This is major.
Treasuries
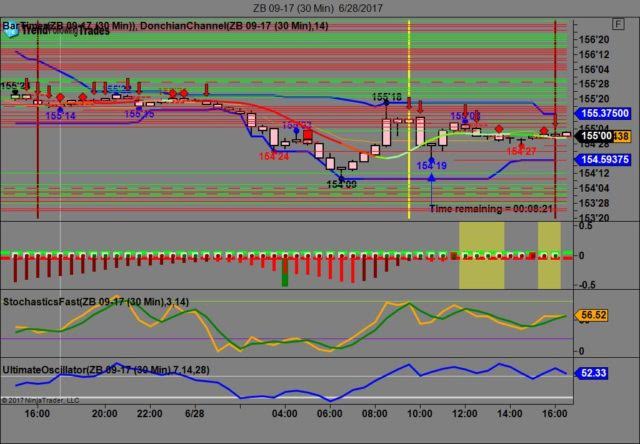
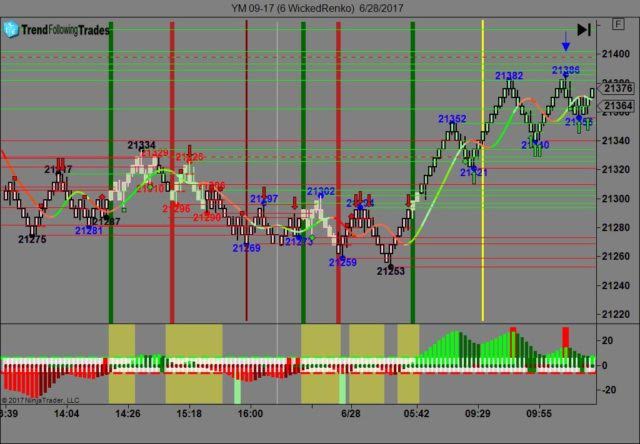
We’ve elected to switch gears a bit and show correlation between the 30 year bond (ZB) and The YM futures contract. The YM contract is the DJIA and the purpose is to show reverse correlation between the two instruments. Remember it’s liken to a seesaw, when up goes up the other should go down and vice versa.
Yesterday the ZB made it’s move at around 10:30 AM EST around the time crude oil inventories was reported. The ZB hit a low at around that time and the YM hit a high. If you look at the charts below ZB gave a signal at around 10:30 AM and the YM was moving Lower at the same time. Look at the charts below and you’ll see a pattern for both assets. ZB hit a low at around 10:30 AM and the YM hit a high. These charts represent the newest version of Trend Following Trades and I’ve changed the timeframe to a 30 minute chart to display better. This represented a long opportunity on the 30 year bond, as a trader you could have netted about 20 plus ticks per contract on this trade. Each tick is worth $31.25. We added a Donchian Channel to the charts to show the signals more clearly. Please note that the front month for the ZB contract is now September, 2017.
Charts Courtesy of Trend Following Trades built on a NinjaTrader platform Click on an image to enlarge it.
Bias
Yesterday we gave the markets a neutral bias as just about all the instruments we track were pointed lower (with the exception of Gold). Hence the neutral bias. The Dow gained 144 points and the other indices gained ground as well. Today we aren’t dealing with a correlated market however our bias is to the Upside.
Could this change? Of Course. Remember anything can happen in a volatile market.
Commentary
Yesterday we gave the markets a neutral bias as just about all the instruments we track was pointed lower. Whenever you have a situation where everything is either pointed lower or higher, there is no market correlation thus there is no direction, hence the neutral bias. A neutral bias means the markets could go in any direction. Yesterday we were fortunate in that it rose in value. It would seem that the markets are getting adjusted to no vote on the healthcare bill with no vote or date set as of yet. Time will tell how this all works out….
Author

Nick Mastrandrea
Market Tea Leaves


