The markets say no [Video]
![The markets say no [Video]](https://editorial.fxstreet.com/images/Markets/Equities/display-stock-market-charts-23026797_XtraLarge.jpg)
US Dollar: Sept USD Down at 92.810.
Energies: Oct'20 Crude is Up at 41.35.
Financials: The Dec '20 30 year bond is Up 1 tick and trading at 176.16.
Indices: The Sept S&P 500 emini ES contract is 16 ticks Higher and trading at 3355.00.
Gold: The Dec'20 Gold contract is trading Up at 1962.60 Gold is 127 ticks Higher than its close.
Initial Conclusion
This is not a correlated market. The dollar is Down- and Crude is Up+ which is normal but the 30 year Bond is trading Higher. The Financials should always correlate with the US dollar such that if the dollar is lower then bonds should follow and vice-versa. The S&P is Higher and Crude is trading Higher which is not correlated. Gold is trading Higher which is correlated with the US dollar trading Down. I tend to believe that Gold has an inverse relationship with the US Dollar as when the US Dollar is down, Gold tends to rise in value and vice-versa. Think of it as a seesaw, when one is up the other should be down. I point this out to you to make you aware that when we don't have a correlated market, it means something is wrong. As traders you need to be aware of this and proceed with your eyes wide open.
Asia is trading mainly Higher at this time with the exception of the Sense and Singapore exchanges which are Lower. Currently Europe is trading Mixed as well.
Possible Challenges To Traders Today:
-
Current Account is out at 8:30 AM EST. This is Major.
-
CB Leading Index m/m is out at 10 AM EST. This is Major.
-
Prelim UoM Consumer Sentiment is out at 10 AM EST. This is Major.
-
Prelim UoM Inflation Expectations is out at 10 AM EST. This is Major.
Treasuries
We've elected to switch gears a bit and show correlation between the 30 year bond (ZB) and The S&P futures contract. The S&P contract is the Standard and Poor's and the purpose is to show reverse correlation between the two instruments. Remember it's liken to a seesaw, when up goes up the other should go down and vice versa.
Yesterday the ZB made it's move at around 8 AM EST. The ZB hit a High at around that time and the S&P moved Higher. If you look at the charts below ZB gave a signal at around 8 AM EST and the S&P moved Higher at around the same time. Look at the charts below and you'll see a pattern for both assets. ZB hit a High at around 8 AM EST and the S&P was moving Higher shortly thereafter. These charts represent the newest version of MultiCharts and I've changed the timeframe to a 15 minute chart to display better. This represented a Shorting opportunity on the 30 year bond, as a trader you could have netted about 30 ticks per contract on this trade. Each tick is worth $31.25. Please note: the front month for the ZB is now Dec '20. The S&P contract remains at Sept '20. I've changed the format to Renko bars such that it may be more apparent and visible.
Charts Courtesy of MultiCharts built on an AMP platform
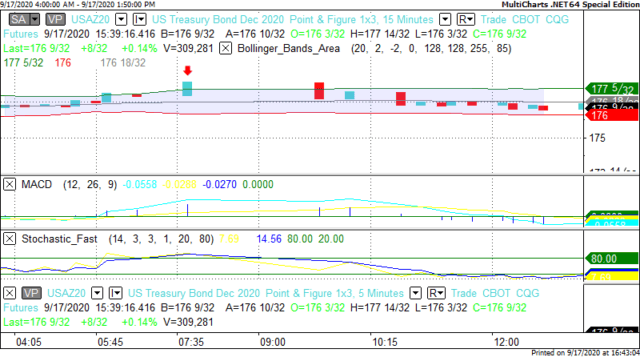
ZB - Dec 2020 - 9/17/20
-637360226543643161.png)
S&P - Sept 2020 - 9/17/20
Bias
Yesterday we gave the markets a Downside bias as both the USD and the Bonds were trading Higher yesterday morning and tis is indicative of a Downside day. The markets didn't disappoint as the Dow dropped 130 point and the other indices lost ground as well. Today we aren't dealing with a correlated market and our bias is Neutral.
Could this change? Of Course. Remember anything can happen in a volatile market.
Commentary
We can't understand but at times as traders we trade what we see not what we think or what makes sense. Yesterday the markets should have gone Higher considering the fact that the Federal Reserve didn't raise the Federal Funds Rate (FFR) or more commonly called the Overnight Rate that the banks use to determine interest rates. The markets however had other ideas as globally the markets fell; not only in the United States but in Europe and Asia as well. Today we have Preliminary numbers on inflation and Consumer Confidence. These are considered to be major as they are preliminary numbers and there is always greater weight associated with preliminary numbers as opposed to Revised.
Author

Nick Mastrandrea
Market Tea Leaves


