US Dollar: Mar. USD is Up at 90.475.

Energies: Feb ’18 Crude is Down at 63.90.

Financials: The Mar 30 year bond is Down 14 ticks and trading at 149.28.

Indices: The Mar S&P 500 emini ES contract is 7 ticks Lower and trading at 2802.00.

Gold: The Feb gold contract is trading Down at 1328.90.  Gold is 103 ticks Lower than its close.

Initial Conclusion

This is not a correlated market.  The dollar is Up+  and Crude is Down-  which is normal but the 30 year Bond is trading Lower.  The Financials should always correlate with the US dollar such that if the dollar is lower then bonds should follow and vice-versa. The S&P is Lower and Crude is trading Down- which is not correlated. Gold is trading Down- which is correlated with the US dollar trading Up+.   I tend to believe that Gold has an inverse relationship with the US Dollar as when the US Dollar is down, Gold tends to rise in value and vice-versa. Think of it as a seesaw, when one is up the other should be down. I point this out to you to make you aware that when we don’t have a correlated market, it means something is wrong. As traders you need to be aware of this and proceed with your eyes wide open.

At this hour Asia is trading mainly Higher with the exception of the Nikkei and Singapore exchanges which are Lower at this time.  As of this writing Europe is trading Mixed.

Possible Challenges To Traders Today

  • Building Permits is out at 8:30 AM.  This is major.

  • Housing Starts is out at 8:30 AM.  This is major.

  • Philly Fed Mfg Index is out at 8:30 AM EST.  This is major.

  • Unemployment Claims is out at 8:30 PM EST.  This is major.

  • Natural Gas Storage is out at 10:30 AM EST.  Major.

  • Crude Oil Inventories is out at 11 AM EST.  Major.
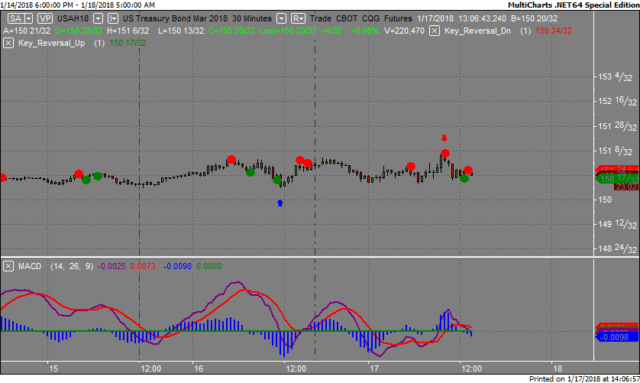
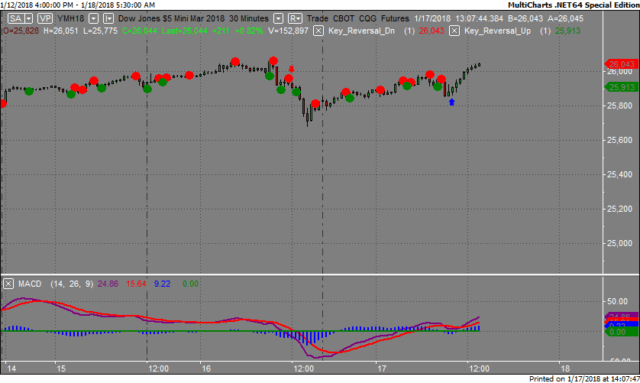
Treasuries

We’ve elected to switch gears a bit and show correlation between the 30 year bond (ZB) and The YM futures contract.  The YM contract is the DJIA and the purpose is to show reverse correlation between the two instruments.  Remember it’s liken to a seesaw, when up goes up the other should go down and vice versa.

Yesterday the ZB made it’s move at around 10 AM EST.   The ZB hit a High at around that time and the YM hit a Low.  If you look at the charts below ZB gave a signal at around 10 AM EST and the YM was moving Higher at the same time. Look at the charts below and you’ll see a pattern for both assets. ZB hit a High at around 10 AM and the YM hit a Low.  These charts represent the newest version of MultiCharts and I’ve changed the timeframe to a 30 minute chart to display better.  This represented a shorting opportunity on the 30 year bond, as a trader you could have netted about 20 ticks per contract on this trade.  Each tick is worth $31.25.

Charts Courtesy of MultiCharts built on an AMP platform.

Chart


Chart

Bias

Yesterday we gave the markets an Upside bias as the Bonds and Gold were both trading Lower yesterday morning and this usually reflects an Upside day.  The markets didn’t disappoint as the Dow soared 323 points and the other indices gained ground as well.  Today we aren’t dealing with a correlated market and our bias is Neutral.

Could this change? Of Course.  Remember anything can happen in a volatile market. 

Commentary

This market seems to have a strategy of one day trade lower and the next day trade much higher going to a higher high.  We predicted that the markets would advance yesterday morning but 323 points in 1 day?  Wow!!!  This is not usual and customary and this is at a time when Bitcoins are losing ground.  Today we have real estate numbers in terms of Housing Starts and Building Permits and that is always major and a proven market mover.

Trading performance displayed herein is hypothetical. The following Commodity Futures Trading Commission (CFTC) disclaimer should be noted.

Hypothetical performance results have many inherent limitations, some of which are described below. No representation is being made that any account will or is likely to achieve profits or losses similar to those shown.

In fact, there are frequently sharp differences between hypothetical performance results and the actual results subsequently achieved by any particular trading program. One of the limitations of hypothetical performance trading results is that they are generally prepared with the benefit of hindsight.

In addition, hypothetical trading does not involve financial risk, and no hypothetical trading record can completely account for the impact of financial risk in actual trading. For example, the ability to withstand losses or to adhere to a particular trading program in spite of trading losses are material points which can also adversely affect actual trading results.

There are numerous other factors related to the markets in general or to the implementation of any specific trading program which cannot be fully accounted for in the preparation of hypothetical performance results and all of which can adversely affect actual trading results.

Trading in the commodities markets involves substantial risk and YOU CAN LOSE A LOT OF MONEY, and thus is not appropriate for everyone. You should carefully consider your financial condition before trading in these markets, and only risk capital should be used.

In addition, these markets are often liquid, making it difficult to execute orders at desired prices. Also, during periods of extreme volatility, trading in these markets may be halted due to so-called “circuit breakers” put in place by the CME to alleviate such volatility. In the event of a trading halt, it may be difficult or impossible to exit a losing position.

Recommended Content


Recommended Content

Editors’ Picks

EUR/USD retreats toward 1.0650 after PMI-inspired rebound

EUR/USD retreats toward 1.0650 after PMI-inspired rebound

EUR/USD loses traction and retreats to the 1.0650 area after rising toward 1.0700 with the immediate reaction to the upbeat PMI reports from the Eurozone and Germany. The cautious market stance helps the USD hold its ground ahead of US PMI data.

EUR/USD News

GBP/USD fluctuates near 1.2350 after UK PMIs

GBP/USD fluctuates near 1.2350 after UK PMIs

GBP/USD clings to small daily gains near 1.2350 in the European session on Tuesday. The data from the UK showed that the private sector continued to grow at an accelerating pace in April, helping Pound Sterling stay resilient against its rivals.

GBP/USD News

Gold flirts with $2,300 amid receding safe-haven demand

Gold flirts with $2,300 amid receding safe-haven demand

Gold (XAU/USD) remains under heavy selling pressure for the second straight day on Tuesday and languishes near its lowest level in over two weeks, around the $2,300 mark in the European session. Eyes on US PMI data. 

Gold News

Here’s why Ondo price hit new ATH amid bearish market outlook Premium

Here’s why Ondo price hit new ATH amid bearish market outlook

Ondo price shows no signs of slowing down after setting up an all-time high (ATH) at $1.05 on March 31. This development is likely to be followed by a correction and ATH but not necessarily in that order.

Read more

US S&P Global PMIs Preview: Economic expansion set to keep momentum in April

US S&P Global PMIs Preview: Economic expansion set to keep momentum in April

S&P Global Manufacturing PMI and Services PMI are both expected to come in at 52 in April’s flash estimate, highlighting an ongoing expansion in the private sector’s economic activity.

Read more

Majors

Cryptocurrencies

Signatures