The Markets Bounce Back [Video]
![The Markets Bounce Back [Video]](https://editorial.fxstreet.com/images/Markets/Currencies/Majors/DollarIndex/rows-of-dollars-bundles-background-19722556_XtraLarge.jpg)
US Dollar: June USD is Down at 96.505.
Energies: May '19 Crude is Up at 64.55.
Financials: The Jun 30 year bond is Down 9 ticks and trading at 146.02.
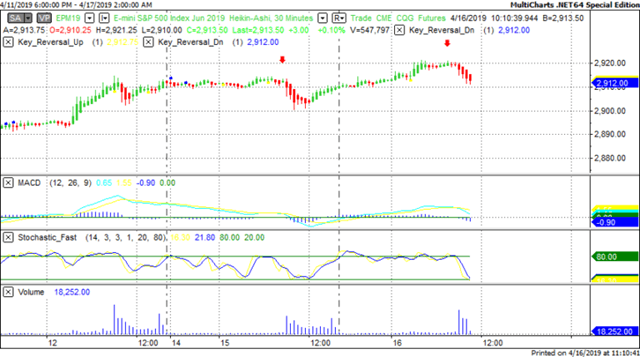
Indices: The June S&P 500 emini ES contract is 17 ticks Higher and trading at 2915.75.
Gold: The June Gold contract is trading Up at 1280.80 Gold is 36 ticks Higher than its close.
Initial Conclusion
This is not a correlated market. The dollar is Down- and Crude is Up+ which is normal and the 30 year Bond is trading Lower. The Financials should always correlate with the US dollar such that if the dollar is lower then bonds should follow and vice-versa. The S&P is Higher and Crude is trading Higher which is not correlated. Gold is trading Higher which is correlated with the US dollar trading Down. I tend to believe that Gold has an inverse relationship with the US Dollar as when the US Dollar is down, Gold tends to rise in value and vice-versa. Think of it as a seesaw, when one is up the other should be down. I point this out to you to make you aware that when we don't have a correlated market, it means something is wrong. As traders you need to be aware of this and proceed with your eyes wide open.
At this hour all of Asia is trading Higher with the exception of the Hang Send which is fractionally Lower. Currently all of Europe is trading Higher with the exception of the London exchange.
Possible Challenges To Traders Today
-
Trade Balance at 8:30 AM EST. This is major.
-
Final Wholesale Inventories m/m is out at 10 AM EST. This is major.
-
Crude Oil Inventories is out at 10:30 AM EST. This is major.
-
FOMC Member Bullard Speaks at 12:45 PM. This is major.
-
Beige Book is out at 2 PM EST. This is major.
Treasuries
We've elected to switch gears a bit and show correlation between the 30 year bond (ZB) and The YM futures contract. The YM contract is the DJIA and the purpose is to show reverse correlation between the two instruments. Remember it's liken to a seesaw, when up goes up the other should go down and vice versa.
Yesterday the ZB made a major move at around 8 AM EST. The ZB hit a Low at around that time and the YM hit a High. If you look at the charts below ZB gave a signal at around 8 AM EST and the YM was moving Lower at the same time. Look at the charts below and you'll see a pattern for both assets. ZB hit a Low at around 8 AM and the YM was moving Lower at the same time. These charts represent the newest version of MultiCharts and I've changed the timeframe to a 15 minute chart to display better. This represented a Long opportunity on the 30 year bond, as a trader you could have netted about 10 ticks per contract on this trade. Each tick is worth $31.25. Please note: the front month for the ZB contract is now June, 2019
Charts Courtesy of MultiCharts built on an AMP platform.
-636910890332434447.png)
Bias
Yesterday we gave the markets an Upside bias and the markets didn't disappoint. The Dow rose 68 points and the other indices rose as well. Today we aren't dealing with a correlated market and our bias is to the Upside.
Could this change? Of Course. Remember anything can happen in a volatile market.
Commentary
Yesterday our rules prevailed as we predicted an upside and that's exactly what we got. We mentioned yesterday that we will take each day as it comes and utilize our rules of Market Correlation and that's exactly what we shall do. Today we have the Fed Beige Book out at 2 PM EST which will make trading interesting the afternoon.
Author

Nick Mastrandrea
Market Tea Leaves


