The market timing and the US general elections
Many World Indices, Stocks and ETFs have been rallying since the March 2020 lows. As we always say at EWF: “Nothing lasts forever nor runs in a straight line – when it comes to the market”. In fact, we believe in the idea that the market trades between defined areas. These areas need to be reached. Also, the market is frequently waiting for an event before making a move.
US Elections and Indices Market
Right now, we are in about 50 days from US General Elections. Most of the time in the past, these have created a lot of volatility across the market. Back in 2016, we were able to catch the reaction higher during the Election night. And we hope to do the same this year. The following article is explaining how we were able to buy the Indices that night into a huge rally. Back in 2016, the Market was primed for a rally. Indices were trading within a bullish sequence. Therefore, the rally towards the new all-time highs was expected. The following chart below shows our expectations as of November 2016:
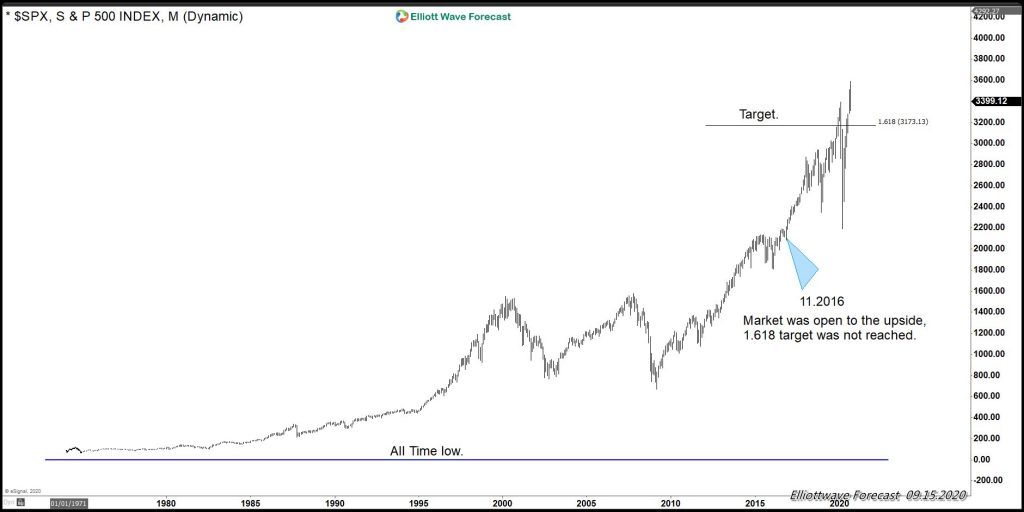
The chart is a representation of the bullish sequence in the $SPX500. Those days, the higher targets have still not been achieved. Therefore, the right side was clearly up and we expected an extension higher. In fact, we were looking for more upside, no matter who would be elected as a president.
Yen Pairs and Indices Market
This time around, however, it is different, a lot different. On the one hand, the Market is not that open to the upside and on the other hand, it is within a fight between the YEN and the Indices. Many YEN pairs are still calling lower. Among them is $SEKJPY which is favored to see more downside. Nevertheless, it does apply to all YEN pairs. As a matter of fact, falling YEN pairs means strong YEN. And as a consequence, a strong YEN translates into Indices moving sideways to lower. Therefore, we do not see that much more upside in the Indices.
Gold prices and Indices Market
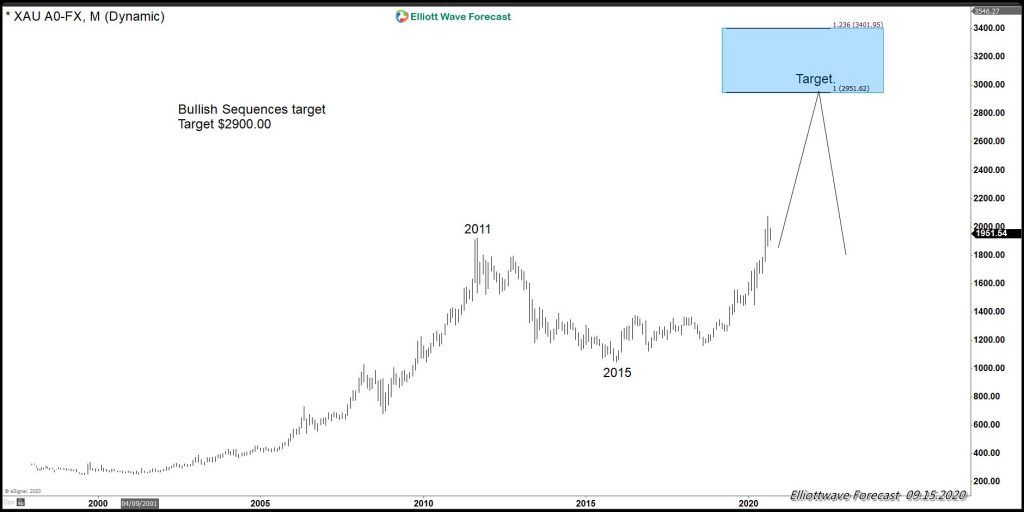
Another, very important instrument entering this year’s US Elections is Gold, which has been trading higher and has broken the 2011 highs. The fact of that break has created a higher high from the all-time lows, i.e., a bullish sequence. Expectation of Gold extending higher is in agreement with the $SEKJPY falling lower. The following chart:
Author

Elliott Wave Forecast Team
ElliottWave-Forecast.com


