The Market Rally Continues [Video]
![The Market Rally Continues [Video]](https://editorial.fxstreet.com/images/Markets/Currencies/Majors/DollarIndex/financial-planning-calculator-closeup-1775995_XtraLarge.jpg)
US Dollar: Sept USD is Down at 96.135.
Energies: July '19 Crude is Up at 57.23.
Financials: The Sept 30 year bond is Down 10 ticks and trading at 155.13.
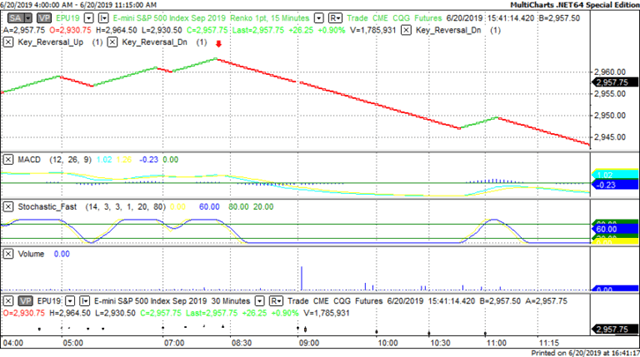
Indices: The Sept S&P 500 emini ES contract is 20 ticks Lower and trading at 2955.00.
Gold: The Aug Gold contract is trading Down at 1391.60. Gold is 53 ticks Lower than its close.
Initial Conclusion
This is not a correlated market. The dollar is Down- and Crude is Up+ which is normal but the 30 year Bond is trading Lower. The Financials should always correlate with the US dollar such that if the dollar is lower then bonds should follow and vice-versa. The S&P is Lower and Crude is trading Higher which is correlated. Gold is trading Lower which is not correlated with the US dollar trading Down. I tend to believe that Gold has an inverse relationship with the US Dollar as when the US Dollar is down, Gold tends to rise in value and vice-versa. Think of it as a seesaw, when one is up the other should be down. I point this out to you to make you aware that when we don't have a correlated market, it means something is wrong. As traders you need to be aware of this and proceed with your eyes wide open.
All of Asia traded Lower with the exception of the Shanghai and Singapore exchanges which is Higher at this time. Currently all of Europe is trading Higher.
Possible Challenges To Traders Today
-
Flash Manufacturing PMI is out at 9:45 AM EST. This is major.
-
Flash Services PMI is out at 9:45 AM EST. This is major.
-
Existing Home Sales is out at 10 AM EST. This is major.
-
FOMC Member Brainard Speaks at 12 PM EST. This is major.
-
Bank Stress Test Results. This is major.
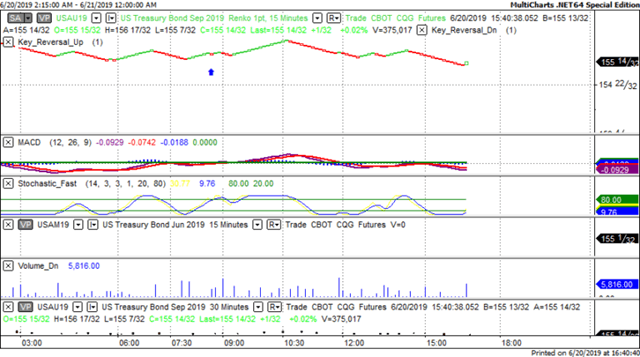
Treasuries
We've elected to switch gears a bit and show correlation between the 30 year bond (ZB) and The YM futures contract. The YM contract is the DJIA and the purpose is to show reverse correlation between the two instruments. Remember it's liken to a seesaw, when up goes up the other should go down and vice versa.
Yesterday the ZB made a major move at around 8:15 AM EST. The ZB hit a Low at around that time and the YM hit a High. If you look at the charts below ZB gave a signal at around 8:15 AM EST and the YM was moving Lower at the same time. Look at the charts below and you'll see a pattern for both assets. ZB hit a Low at around 8:15 AM and the YM was moving Lower at the same time. These charts represent the newest version of MultiCharts and I've changed the timeframe to a 15 minute chart to display better. This represented a Long opportunity on the 30 year bond, as a trader you could have netted about a dozen ticks per contract on this trade. Each tick is worth $31.25. Please note: the front month for both the ZB and YM contract is now September, 2019 and I've changed the format to Renko bars such that it may be more apparent and visible.
Charts Courtesy of MultiCharts built on an AMP platform
Bias
Yesterday we gave the markets a Neutral Bias as we didn't see much in the way of correlation and as such maintained a Neutral Bias. The Dow gained 249 points and the other indices gained ground as well. Today we aren't dealing with a correlated market and our bias is Neutral.
Could this change? Of Course. Remember anything can happen in a volatile market.
Commentary
Yesterday morning we didn't witness much in the way of correlation thru the various instruments we track hence the Neutral bias which means the markets could go in any direction and often does. The markets decided to continue the trend it started Wednesday after the FOMC Meeting and migrate upwards. The Dow gained 249 points and the other indices gained as well. Today we have Existing Home Sales and an FOMC Member speaking, both of which are major and proven market movers.
Author

Nick Mastrandrea
Market Tea Leaves


