The Impact of Monetary Policy on Gold

In March, the World Gold Council released the newest edition of its Investment Update. What can we learn from the publication? Let’s examine the most recent history of Fed tightening and loosening with respect to its effect on gold prices.
Is Fed’s Dovish Turn Positive for Gold?
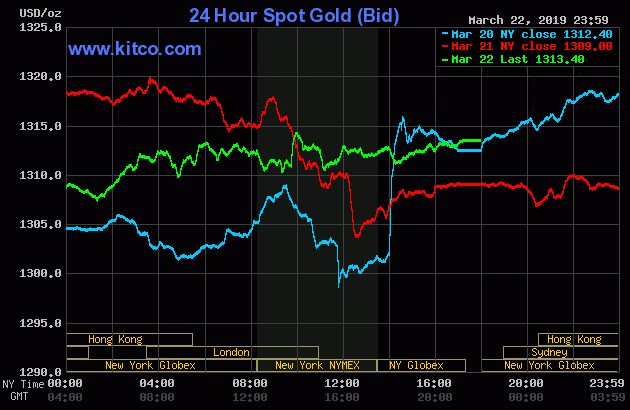
The WGC has recently published the new Investment Update about the effects of monetary policy on gold. The main finding is that, historically speaking, when the US monetary policy turns from being tight into a neutral stance, the price of the yellow metal increases, although this effect is not always immediate. Indeed, the gold’s reaction to the March Fed’s U-turn was initially rather muted, as the chart below shows.
Chart 1: Gold price from March 20 to March 22, 2019.
Why the short-term effects are not clear cut? There might be a few possible explanations, according to the WGC:
-
uncertainty over whether hiking might resume;
-
weakening of inflationary pressure;
-
shift in investor allocation to safe fixed income from riskier assets, in lieu of allocations to gold;
-
an uncertain dollar trajectory (lower interest rates versus safe-haven demand)
We generally agree, but more dovish Fed may often support the risky assets, actually.
The stock market was one of the greatest beneficiaries of the easy monetary and financial conditions in general and quantitative easing in particular.
And what about the longer horizons? Well, the WGC’s analysis indicates that gold does perform better in a post-tightening cycle, but the period over which this occurs varies:
For example, gold rose 3.6% in 2001; 12 months after the Fed stopped raising rates. But it rose 7% only one month after the transition in 2007, a trend that continued as it was 19% higher 12 months after the Fed’s last hike.
The only problem with the WGC’s analysis is that the last Fed’s hike in the previous tightening cycle was in July 2006, not in 2007, as the chart below clearly shows. So, it should be around 5 percent, not 19 percent, as the organization states.
Chart 2: Federal funds rate (green line, left axis, in %) and the price of gold (yellow line, right axis, London P.M. Fix, in $) from January 1999 to February 2019
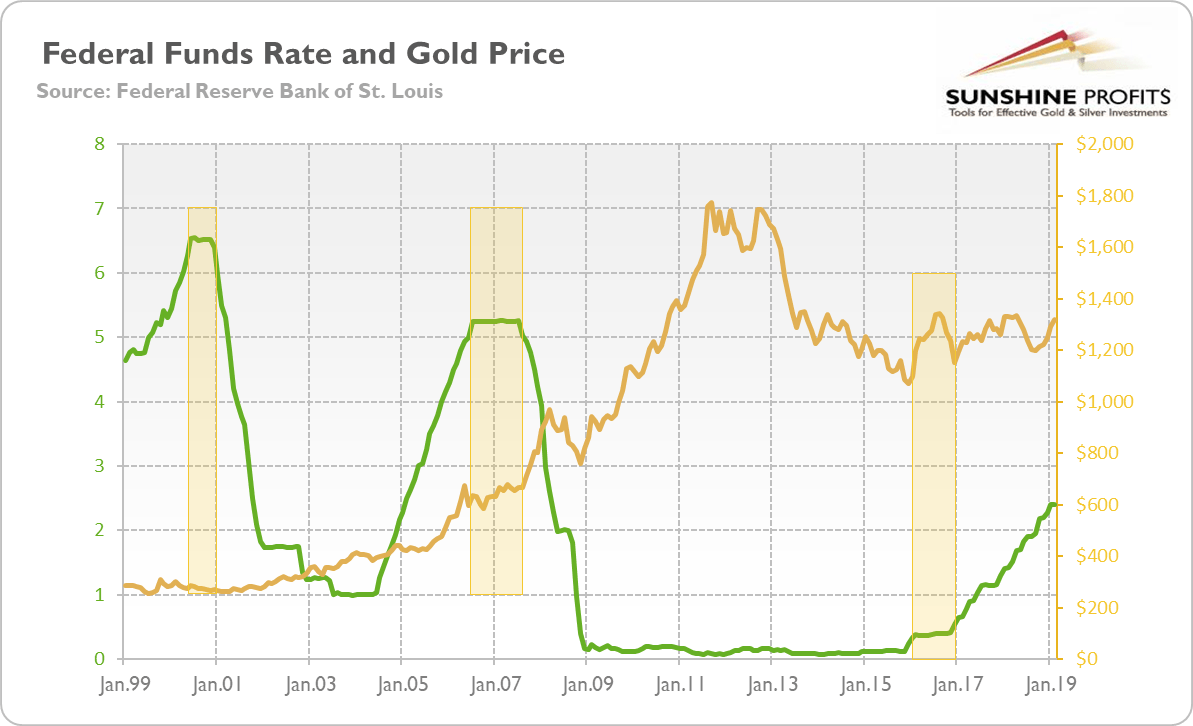
The chart also reveals that the gold prices started to rally only when the Fed began lowering the federal funds rate: with a certain lag in 2001 and more quickly in 2007. Then, after the 2008 bankruptcy of the Lehman Brothers, it declined due to the forced sales to gain liquidity, and started to rally again after the Great Recession was fully in force. The latest case of the Fed’s pause is also very telling. It occurred in 2016 when Yellen was the Fed Chair. The dovish volte-face just after the first hike in December 2015 was positive for the gold prices, but the effect was temporary. When it was clear that it was not a reversal, but only a pause and the further tightening was on the way, the gold prices declined.
Implications for Gold
The latest WGC’s investment update is interesting, but it does not present accurately the periods of the Fed’s switches from tightening into neutral. Hence, our analysis, with adequate data, is less bullish.
The key takeaway is that keeping rates steady by the Fed removes significant headwinds for the gold market. However, gold starts go up only when the Fed begins to cut interest rates. The Fed’s pause in 2016 was positive for the yellow metal, but the effect was temporary when the US central bank returned to normalize its monetary policy again.
Hence, the gold’s future depends on whether the current dovish U-turn is only a pause or whether it is a prelude to cutting rates. The markets expect one cut this year, so if traders are right, gold may shine. But if the global growth accelerates again later this year or in 2020, as we expect it to, the Fed may deliver one or two more hikes. Gold will not escape the sideways trend, then.
Want free follow-ups to the above article and details not available to 99%+ investors? Sign up to our free newsletter today!
Author

Arkadiusz Sieroń
Gold Price Forecast
Arkadiusz Sieroń received his Ph.D. in economics in 2016 (his doctoral thesis was about Cantillon effects), and has been an assistant professor at the Institute of Economic Sciences at the University of Wrocław since 2017.
















