The Gold/Silver Ratio Could Pay Handsomely In Silver

Price action on the gold/silver ratio suggests a correction could be underway, to Silver’s advantage.
It goes without saying that gold has had a stellar couple of months and, given the backdrop of global negative yields and the potential for a Fed easing cycle (even though they currently deny this), we expect gold’s trend to push higher as the year develops.
Indeed, it was the June Fed meeting which saw gold explode to new highs and break key resistance, which suggests dominant momentum has realigned with its longer-term secular trend. If that is the case, we’d also expect record new highs over the coming years.
The renewed lust for gold has also seen demand for silver rise which has seen large speculators net-long for 10-consecutive weeks. And, whilst gold remains the key driver behind the move, perhaps Silver has some catching up to do on a relative basis to gold. And this is where the gold/silver ratio becomes interesting.
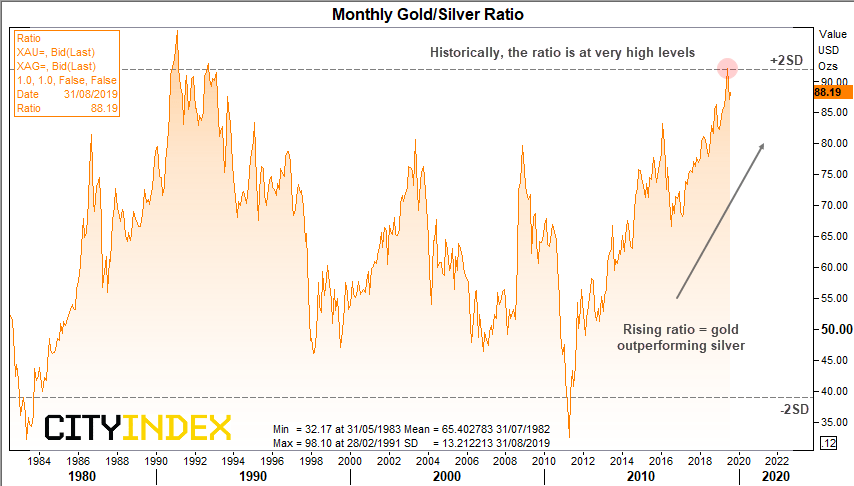
The gold/silver ratio essentially shows us how many bars of silver it takes to buy an ounce of gold. Currently around 88, the gold/silver ratio hit its highest level in 27 years in June after trading above + standard deviations from its long-term average. Whilst the ratio remains in a clear uptrend, there are signs of over-extension, to suggest silver could outperform gold over the coming months.
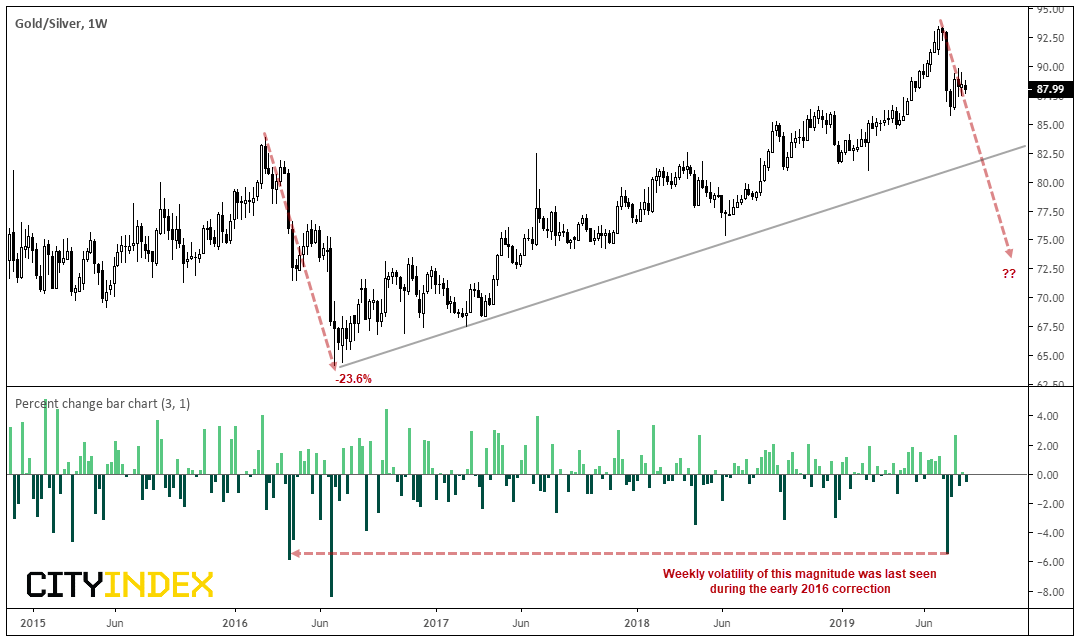
Taking a closer look at the weekly candles, the ratio fell over -5% mid-July, amid its most bearish week since May 2016. In fact, such levels of volatility have not been seen since H1 2016 when investors were also fretting about a China slowdown and global growth. In fact, the ratio fell 23.6% over an 18-week period as silver outperformed gold from the end of February 2016. If a 20% or more drop were to occur during this correction the ratio could fall below 75 whilst Silver closed its gap with gold’s tailwind.
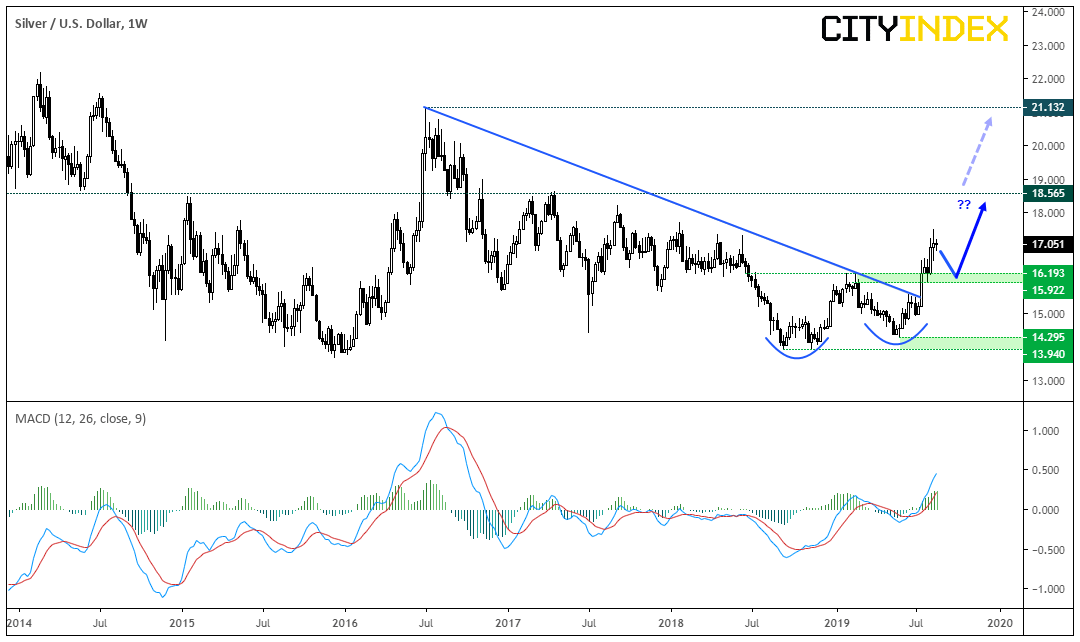
Switching to silver (XAG/USD) we can see it has recently broken out of a basing pattern and invalidated a bearish trendline. Furthermore, the MACD is above its signal line and zero to show a build-up of bullish momentum.
-
As metals could be headed for a pullback, bulls could consider buying dips above the $16 support zone ($1592-$16.19 to be precise) with a view to target the $18.56 and $21.12 highs over the near-term.
-
However, if the ratio is to perform a double-digit correction, Silver could indeed break to new highs.
-
A break back below places it onto the backburner, a break beneath the $14 lows invalidates the bullish bias.
Author

Matt Simpson, CFTe, MSTA
CityIndex
Matt Simpson is a certified technical analyst who combines charts and fundamentals to generate trading themes.


