The GBP/USD is shooting for the stars

The GBP/USD gave contrarian traders another reason to be excited yesterday when it suddenly changed course and started depreciating. What is even more interesting is that it did so in a spectacular fashion - by developing a very easily discernible 'Shooting Star' candle on the daily chart, which represents a classic trend reversal pattern. This has excited bears who have been waiting for the emergence of a correction since late-August.
The sudden change in the underlying market sentiment was triggered following the release of the better-than-expected manufacturing data in the US for August. The ISM-Manufacturing PMI numbers for the previous month surpassed the initial forecasts by 1.4 index points, which represents a considerable improvement. Consequently, the value of the dollar jumped as traders perceived the data as an indication that the restrictive measures in the US have not had the detrimental impact on industrial activity that was initially feared.
These developments staved off the advance of the pound at least temporarily, as the greenback hawks have retained control in the short-term. Bank of England's Governor is due to speak later today, which could potentially reinvigorate the strength of the pound. Meanwhile, expectations of robust employment data in the US - the Non-Farm Payrolls for August are due for release this Friday – are likely to support the positive momentum of the dollar further.
The purpose of today's analysis is to examine all of these fundamentals, and subsequently to determine whether or not the GBP/USD pair is indeed ready to develop a new bearish correction.
1. Long-Term Outlook
As can be seen on the daily chart below, yesterday's shooting star reached the major resistance level at 1.34800, which has been prevalent since December 2019, before it rebounded from it. Moreover, this resistance level coincided with the upper boundary of a broader ascending channel, which makes the retracement even more significant—the rebound from the two increases the likelihood for the development of a new bearish correction.
The price action could fall to three potential levels before it finds the necessary support to stop the evolving bearish correction. The first of these is the middle line of the ascending channel. As of the 2nd of September, this central line roughly coincides with the previous swing high, which makes it a prominent floating support.
Should the price action manage to break down below the latter and the 30-day MA (in green), the next target level would be the 23.6 per cent Fibonacci retracement at 1.29986. This seems like the most likely scenario given the psychological significance of this level, which is positioned just below the 1.3000 mark. Additionally, the 23.6 per cent Fibonacci represents a prominent benchmark for the broader bullish trend, which makes it a very probable target for any emerging bearish correction.
If the bearish momentum is robust enough to drive the price action even below the 23.6 per cent Fibonacci, the final target level for the correction would be the channel's lower edge. This is demonstrated on the chart below. However, if the establishment of such a correction gets protracted in time, the channel's lower edge could coincide with the 23.6 per cent Fibonacci by the time the price action comes close to it, which would render this final target level void.
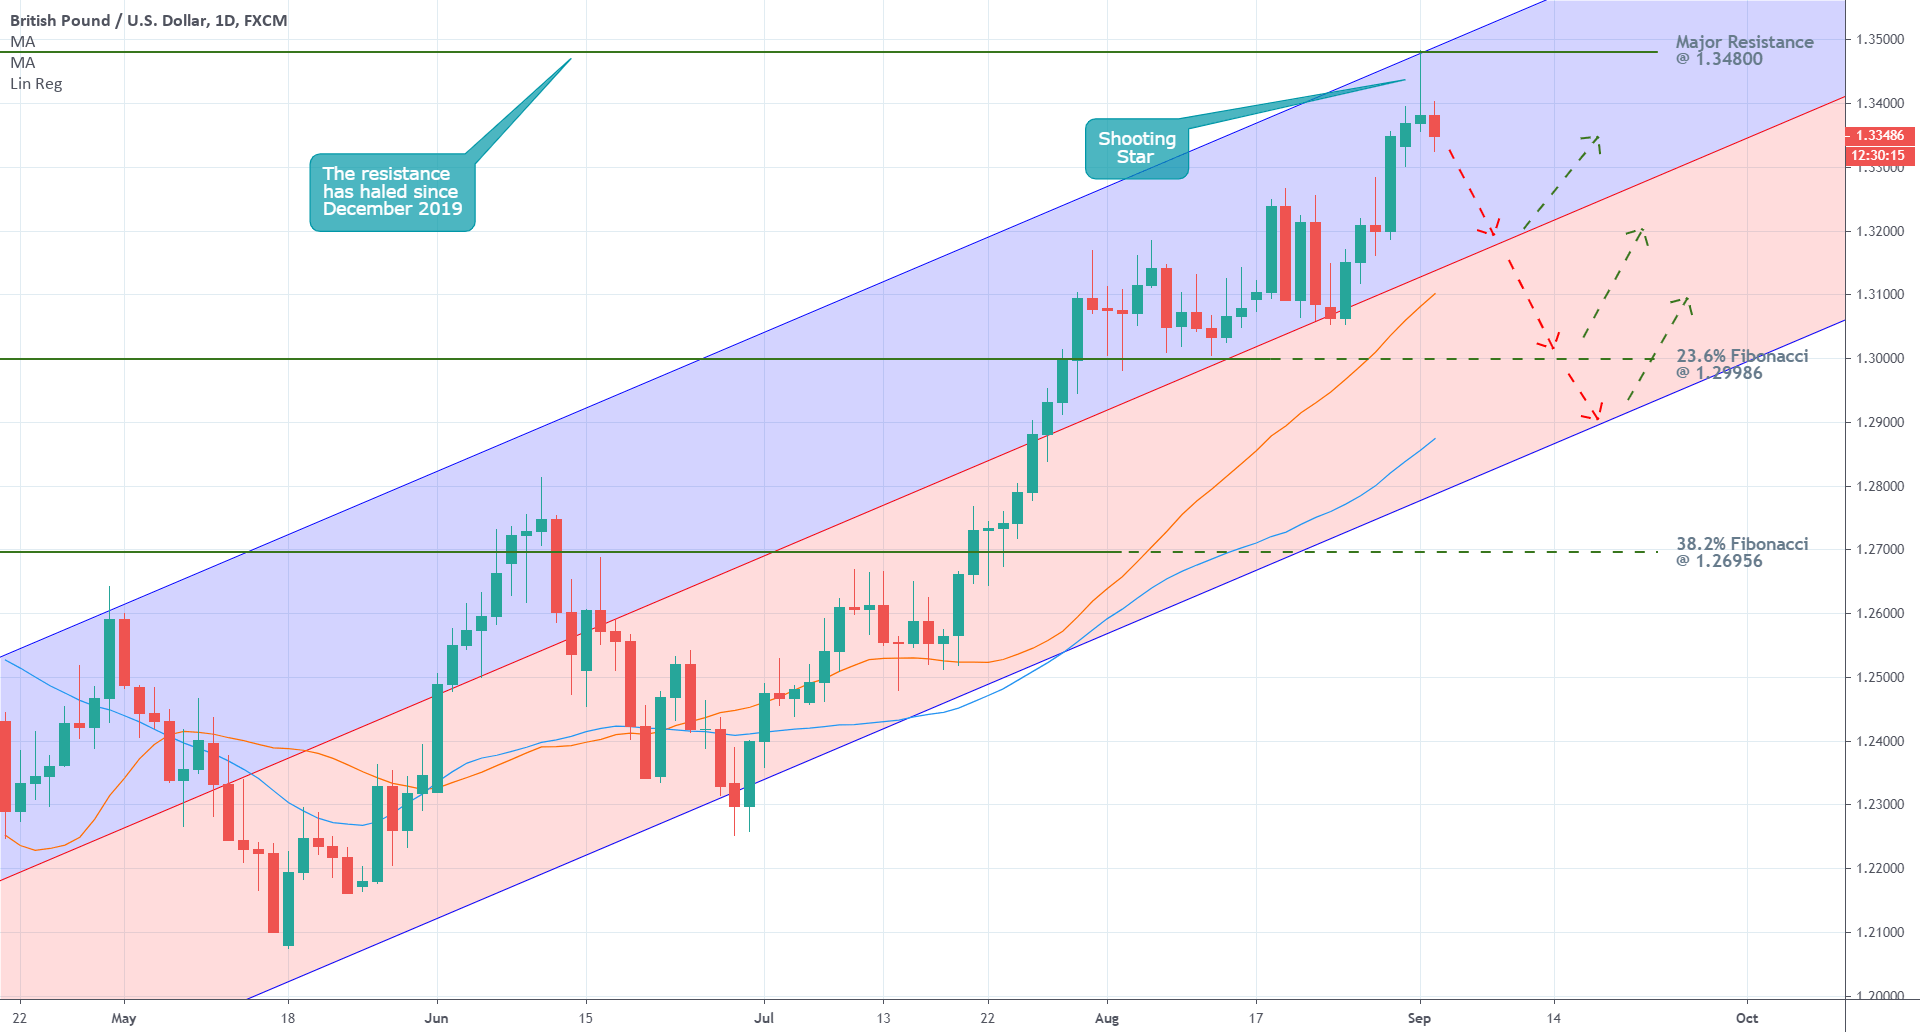
Finally, it is worthwhile mentioning that the price action remains concentrated above the 30-day MA, which, in turn, is positioned above the 50-day MA (in blue). This ascending order highlights the prevailing bullish sentiment in the long run. The observed changes in the market sentiment encompass only the short-run, which is why traders should not delude themselves into believing that the bullish pressure has been completely removed from the market.
2. Short-Term Outlook
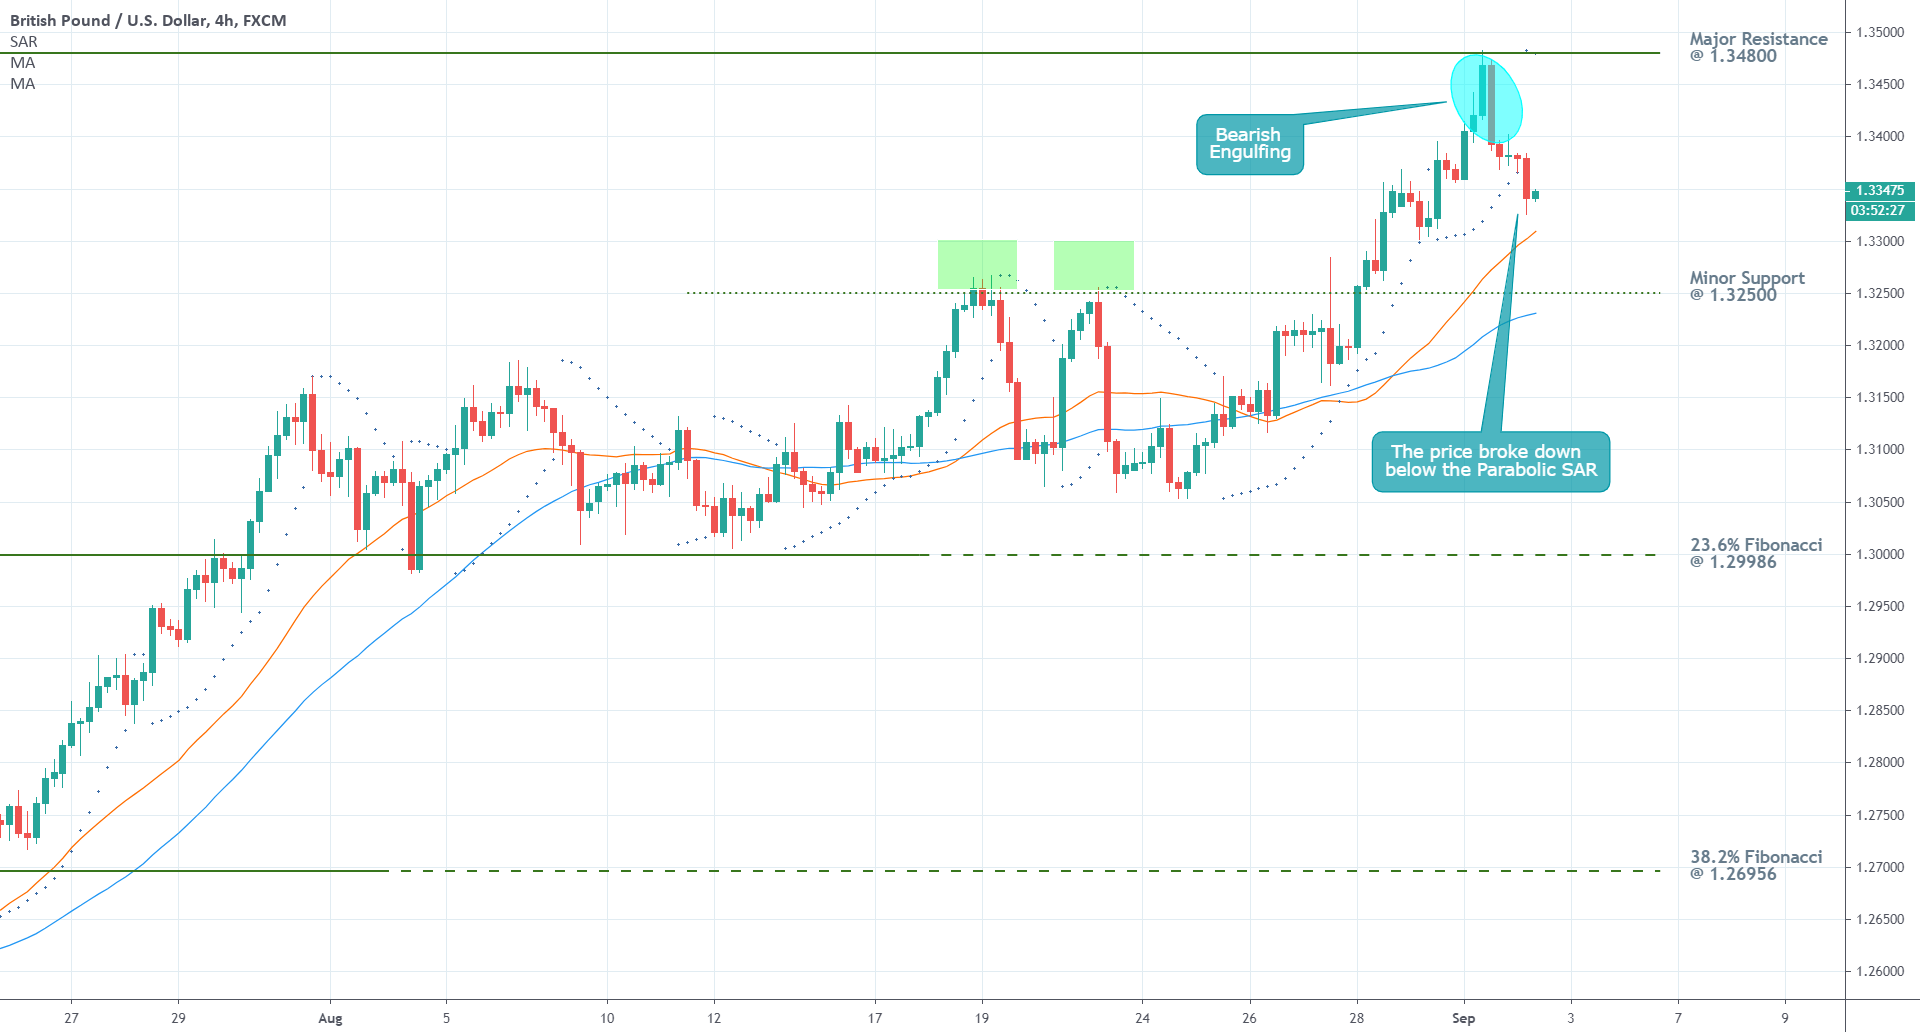
The aforementioned 'Shooting Star' on the daily chart takes the form of a 'Bearish Engulfing' on the 4H chart below. This is yet another trend reversal pattern, that has an inherently bearish sentiment.
Notice that the bearish pressure from yesterday was continued today, as the latest candle broke down below the Parabolic SAR indicator. This represents a significant development and confirms the anticipations of the bears for further dropdowns in the near term.
Yet again, the 30-day MA plays the role of the closest floating support to the current price action, which makes it the first potential challenge for the increasing bearish bias in the market. Meanwhile, the 50-day MA converges towards the minor support level at 1.32500, which makes it the next point of interest.
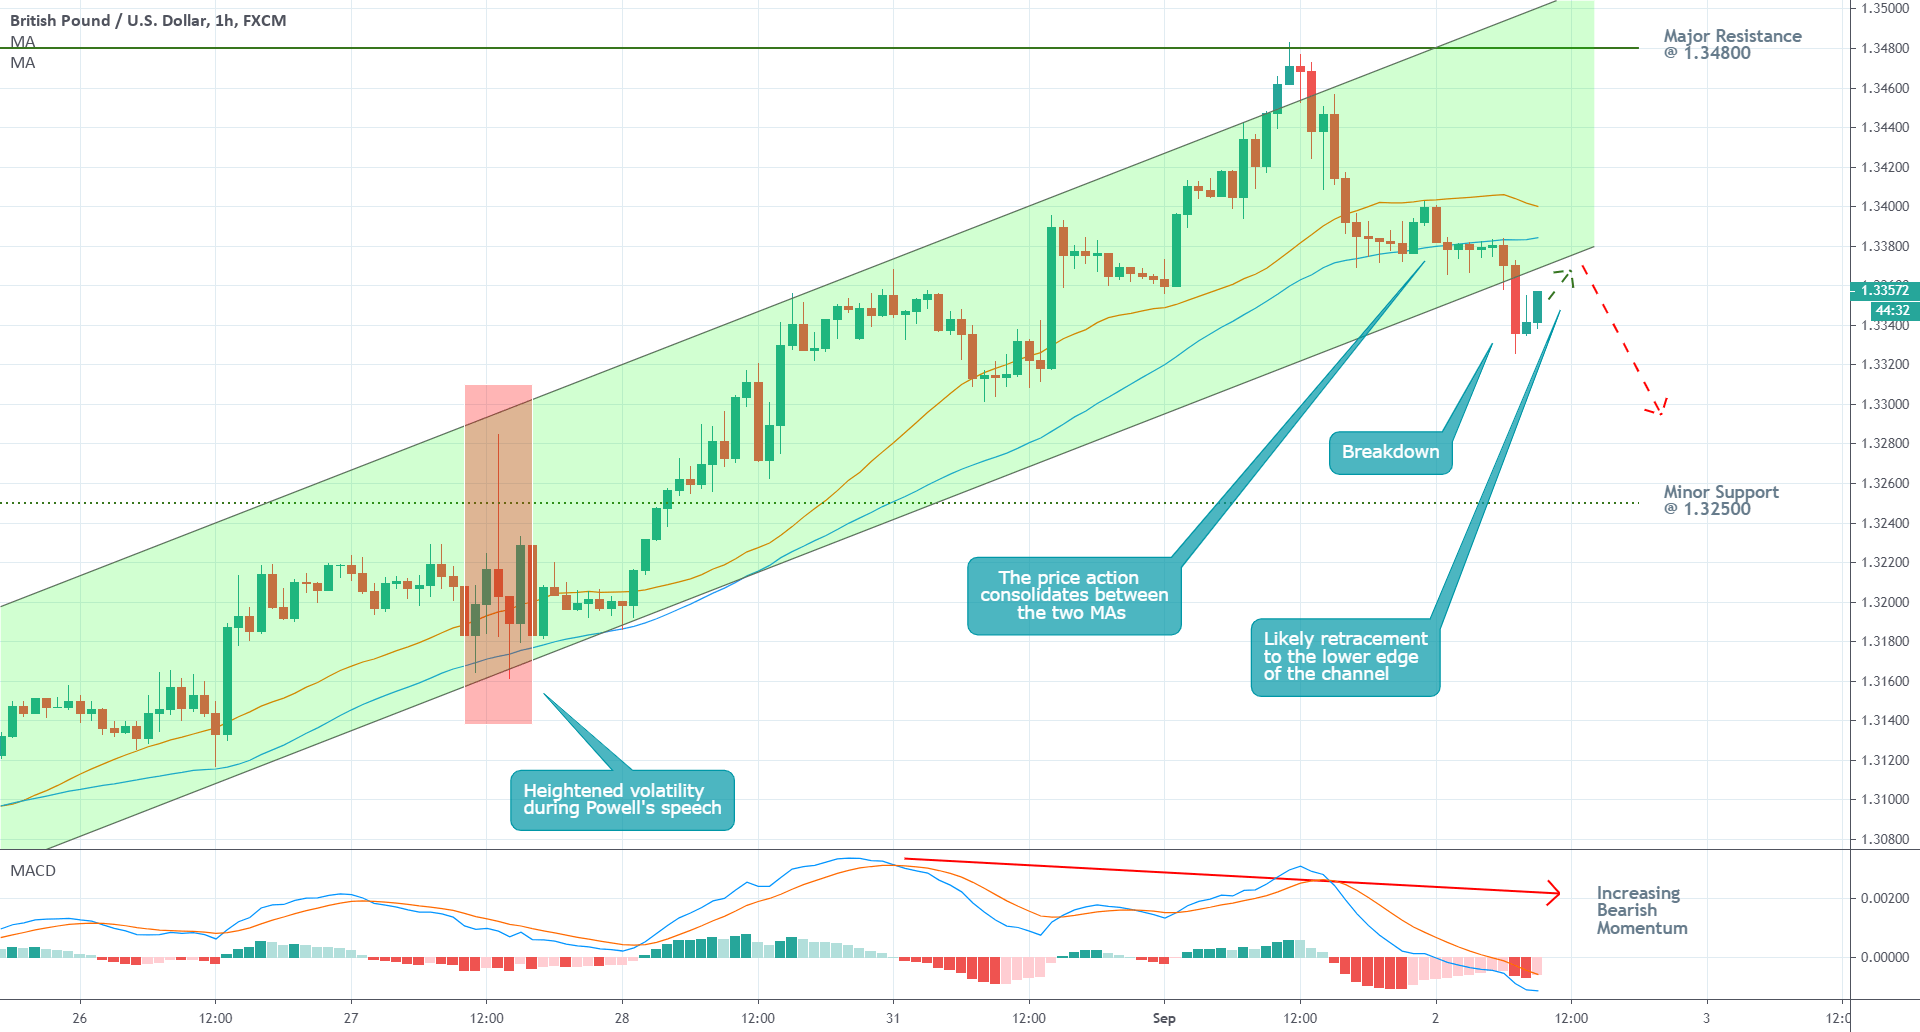
Finally, the hourly chart below manifests the promptly increasing bearish momentum in the short-term, which can be inferred from the MACD indicator.
The price action successfully broke down below the two MAs, which represents a perfect descending order in the short-term. In other words, the hourly chart below confirms the prevailing expectation – the market bias is ostensibly bearish in the short-term, whereas it remains mostly bullish in the longer-term.
Notice that the price action is currently developing a minor retracement towards the ascending channel's lower boundary following the recent breakdown. This is unsurprising and is likely to be followed by a new significant downswing once the retracement is concluded.
3. Concluding Remarks
The current market setup entails the implementation of trend reversal trading strategies, as bears weigh in on the likelihood for the development of a new correction. Yet, they should be cautious as the strengthening of the dollar started yesterday, and it is still too early to say whether or not the greenback can keep up the tempo.
Author

Plamen Stoyanov
Trendsharks
Plamen started his career on the global capital markets in 2012 when he began trading with financial derivatives.


