The GBP/USD could be overwhelmed by the end of the week

The cable is set to have another turbulent week ahead. Protracted Brexit woes continue to exacerbate the underlying volatility currently affecting the British pound, as trade negotiations between the UK and the EU have reached a new impasse. Boris Johnson, who is playing a hard-line role opposite Angela Merkel and Emmanuel Macron, has until this Friday (15th of October) to decide whether to break off the talks with his European counterparts.
It is in the best interest of both parties for a solution to the impasse to be reached before the deadline, which is why the market has mostly disregarded the possibility of a no-deal conclusion. If London and Brussels manage to find common ground before Friday, the value of the GBP/USD is likely to be affected by the manner in which the market discounts the agreement – it boils down to which party would eventually crack under pressure. Therefore, the pair could experience heightened volatility outbursts in the following days, as the market prices in every development concerning the talks.
Meanwhile, the dollar's retreat has been momentarily suspended as the Presidential race in the US continues to bolster the underlying uncertainty. The appeal of the greenback at present stems from investors' heightened demand for havens, to hedge against the unpredictability of the race.
As regards the underlying economic factors that are currently affecting the pair, crucial retail sales data in the US and employment numbers in the UK could further weaken the pound and strengthen the greenback. The consensus forecasts project slightly improved retail data from a month prior in the US, and marginally increased unemployment in the UK.
All of these parallel factors are likely to exert additional pressure on the GBP/USD, which, in turn, would increase the underlying volatility that is currently affecting the pair's price action.
1. Long-Term Outlook:
As can be seen on the daily chart below, there is a divergence between the aforementioned fundamentals and the underlying technicals. The long-term outlook of the price action continues to be prevailingly bullish; however, the strengthening of the dollar and weakening of the pound in the near term could create a new bearish correction.
The price action is currently in the process of establishing a major 1-5 impulse wave pattern, as postulated by the Elliott Wave Theory. Upon reaching a dip at point 4 (in green), which coincided with the 100-day MA (in blue) and the lower boundary of the ascending channel, the price rebounded from the major support level at 1.27600. This latest upswing signals that the price is ready to continue rising further north, with the end goal being the establishment of the final impulse leg (4-5).
However, due to the aforementioned reasons, the price could instead consolidate in a tight range between the major support at 1.27600 and the major resistance at 1.30500. The 50-day MA (in green) represents an additional floating resistance, which substantiates these projections. Accordingly, the 20-day MA (in red) serves as a floating support.
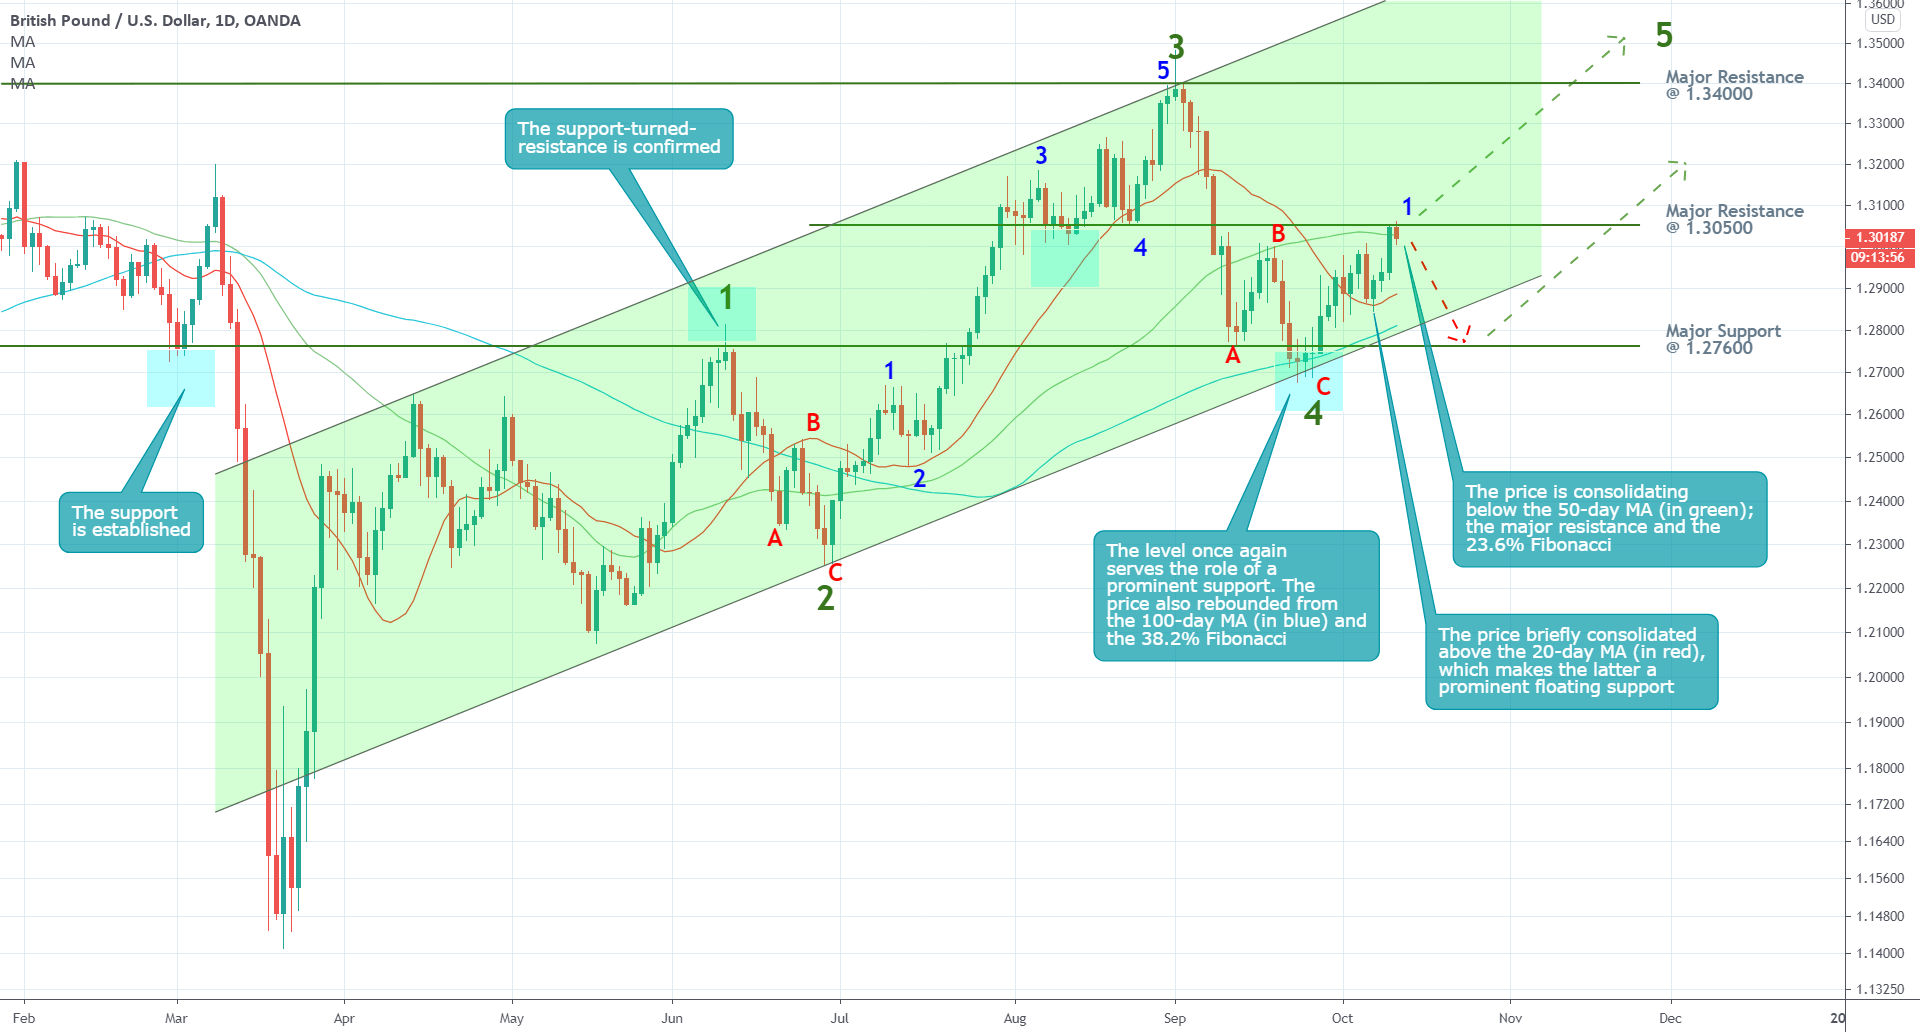
An eventual breakout above the resistance at 1.30500, which has psychological significance as well, would represent a definite confirmation of the bullish sentiment. In the meantime, however, the expected bearish correction could sink as low as the major support at 1.27600 before a reversal occurs. At any rate, a dip could be reached sooner – the 20-day MA and the channel's lower boundary being potential contenders for turning points.
2. Short-Term Outlook:
The recent upswing peaked at the consolidation area, which spans between the psychological level at 1.30000 and the major resistance at 1.30500. The significance of this area as a potential turning point affirms the expectations for a minor bearish pullback.
The price action is likely to consolidate in a range below the resistance in the immediate future. Additionally, there is a high probability for the emergence of false breakouts above set resistance, so the bulls should be aware of such erratic fluctuations.
The behaviour of the price action around the ascending trend line would be of particular interest, as it would likely elucidate the scope of the bearish correction. A tight consolidation around it would entail probable trend-continuation in the immediate future, whereas a decisive breakdown below it could underpin the emergence of a more sizable bearish correction.
For the time being, the underlying momentum continues to be prevailingly bullish; however, its strength appears to be waning. A potential divergence in the near future would imply that the bulls no longer retain control in the market, and the expectations for a more sizable bearish correction would be further justified.
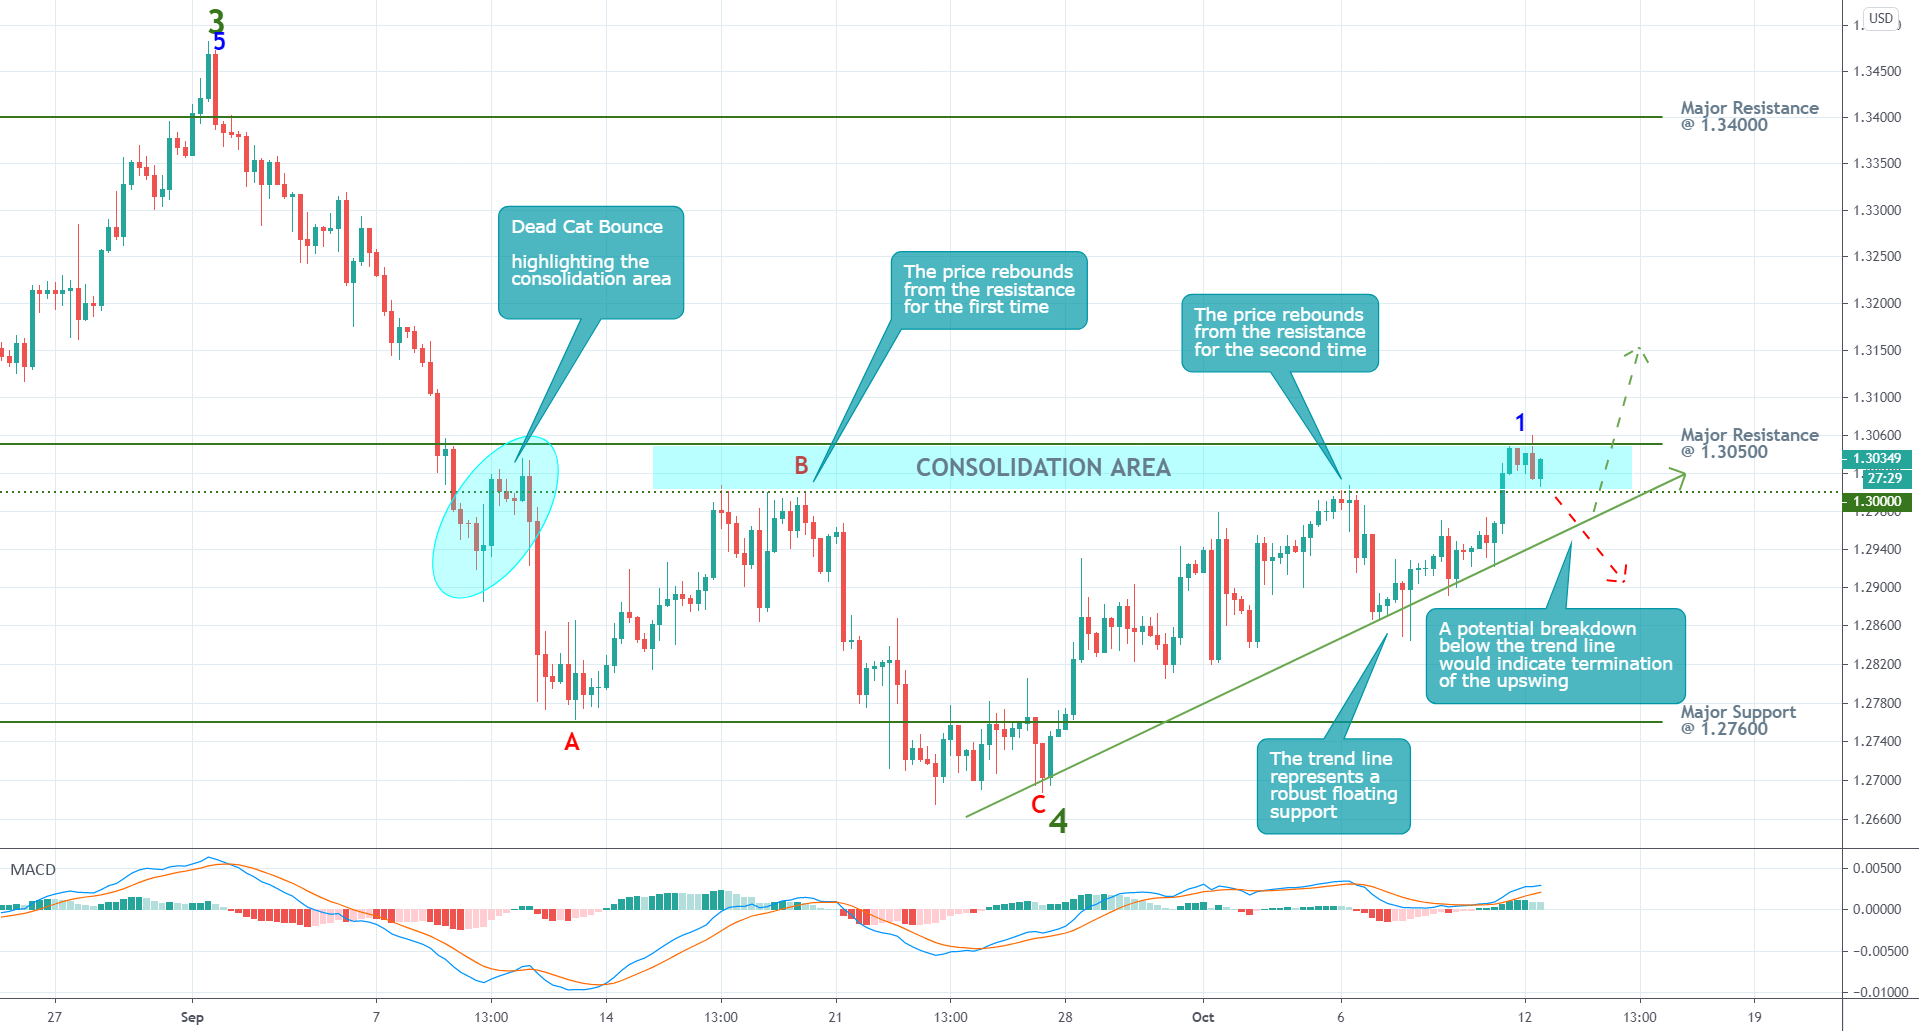
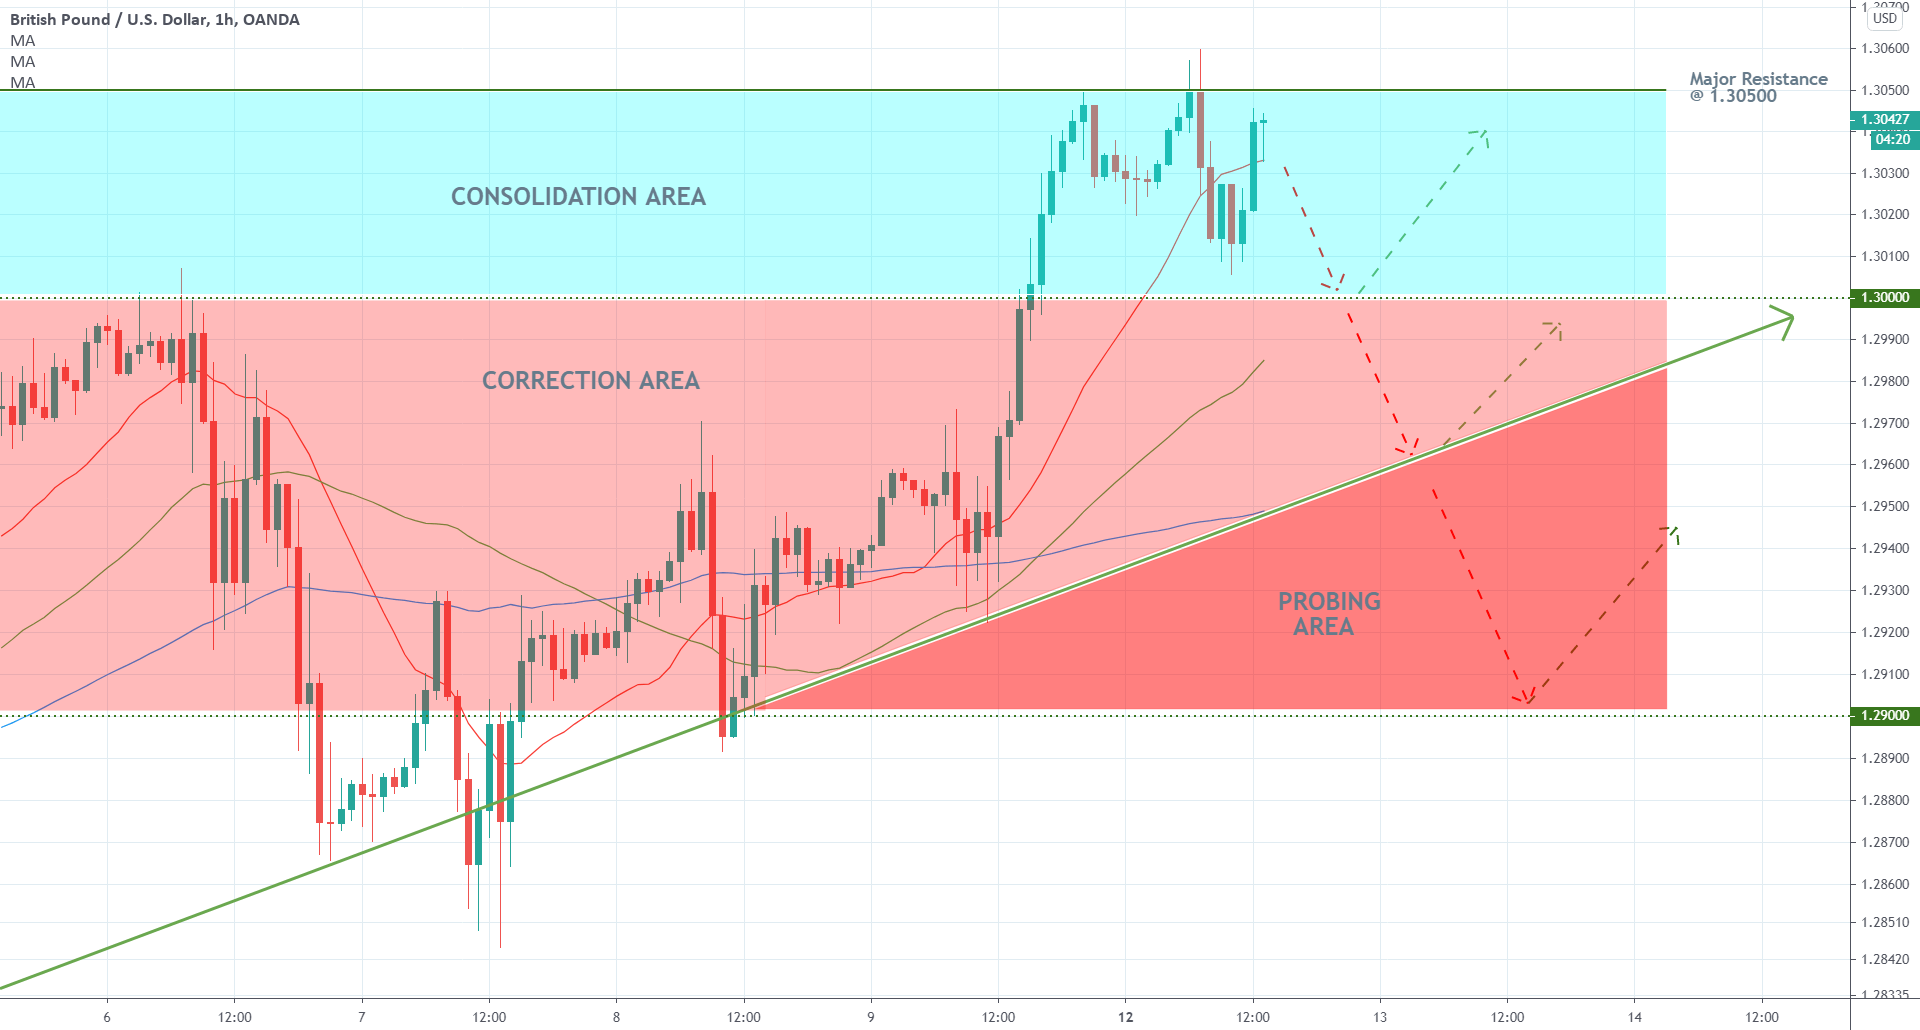
As regards the potential scope and breadth of the expected bearish correction, there are three likely scenarios. Firstly, the price action could remain concentrated within the consolidation area, in which case the dip of the correction should reach the 1.30000 psychological support. This is substantiated by the fact that the level had previously served the role of a major resistance level. Traders should look for potential entries only on the condition that the price action remains trading above the 50-day MA (in green).
Secondly, the price action could sink to the ascending trend line by the end of the week, which seems like the most plausible scenario. The trend line itself outlines the lower border of the correction area. Traders should look for signs of regained bullish momentum similar to the previous times the price action was threading close to the trend line.
Thirdly, the price action could break down below the ascending trend line and the 100-day MA (in blue), in which case it would enter the Probing Area. If this were to happen, traders would have to reconsider using trend-continuation strategies as the underlying bearish sentiment then would be robust enough to terminate the broader uptrend. The next support can be found at 1.29000, so traders would have to look for signs of reversal there.
Of course, the price action could resume heading north immediately, but that should not be interpreted as a definite signal for placing buying orders above the major resistance at 1.30500. As was mentioned earlier, the emergence of false breakouts is quite plausible, so traders should wait for the opportune moment at the end of the next bearish correction in order to join the bullish market. In light of the aforementioned fundamentals, this could take a while.
3. Concluding Remarks:
The underlying setup looks most suitable for the implementation of trend-continuation strategies once the market is done developing the next bearish correction. The bulls should be cautious and patient as the current fundamentals are not suitable for the execution of any buying orders at present. It may take several days before the next opportunity to join the existing trend emerges.
Author

Plamen Stoyanov
Trendsharks
Plamen started his career on the global capital markets in 2012 when he began trading with financial derivatives.

















