The FXB Longer Term Bearish Cycles

Firstly the British Pound Sterling tracking ETF fund FXB inception date was 6/21/2006. The bearish cycle lower from the November 2007 highs in FXB is the focus of this analysis where it begins on the monthly chart. The British Pound Sterling has been the currency of the Bank of England since 1694. Considering that date was back before there was a US Dollar to compare with and data readily available suggests price was at 2.6440 in 1972 assume the trend is down & should continue. Spot price in the GBPUSD foreign exchange was 1.0520 in 1995. Price was at 2.1161 in 2007 where it peaked and turned lower. This is where we will shift the focus to the FXB highs at 211.44 in November 2007.
Secondly the bearish cycle from the November 2007 into the January 2009 lows was clearly an Elliott Wave impulse in 5 waves. From there that lasted into the July 2014 highs appeared to be a typical double three structure with an exception compared to the spot price of foreign exchange where it made a new high above the August 2009 highs in a flat wave y of (II) whereas the FXB did not. I accept this as being similar to the structures a triangle wave "Y" of any degree will not surpass the peak or low of the previous wave "W" of same degree. Also in a similar fashion in running flats the last wave "C" will not take the high or low of the initial wave "A".
Either way it is irrelevant as to what the structure was as the momentum indicators suggested that July 2014 high corrected the cycle from the November 2007 highs. The analysis continues below the monthly chart.
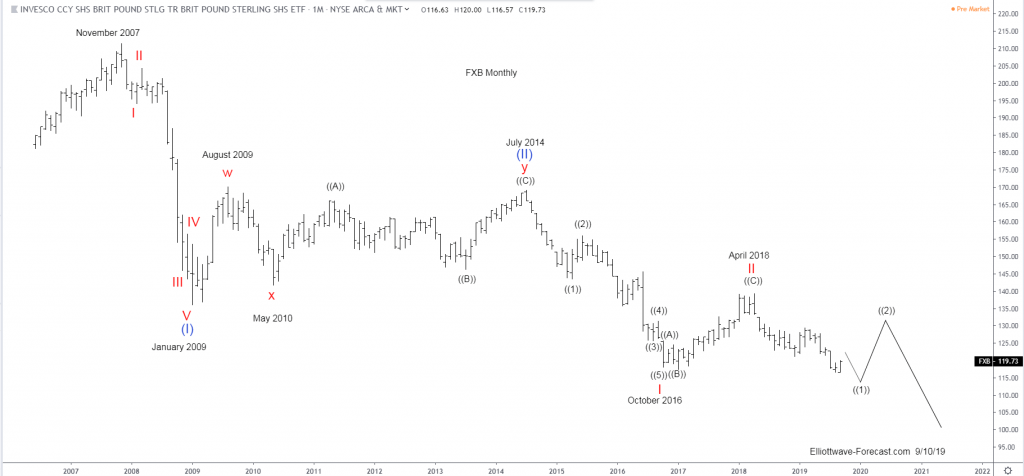
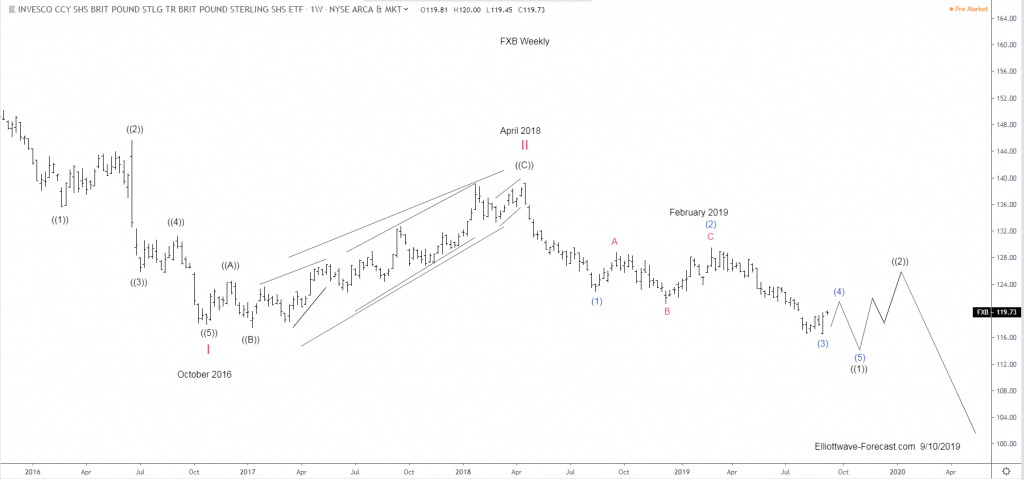
Thirdly The turn lower from the July 2014 highs appears to be an impulse lower into the October 2016 lows. That did not hardly reach equal legs of the initial wave (I) on the monthly chart. Thus I conclude that the impulse lower into the October 2016 lows must be of one smaller degree. This is as shown on the both the monthly and weekly chart. The bounce from the October 2016 lows was an expanded flat with a diagonal ((C)) wave into the April 2018 wave II highs.
From there it is apparent there are 3 impulse cycles. The momentum indicators suggest the wave (3) ended and it is correcting the cycle from the February 2019 highs. The wave (3) is shorter than the wave (1). This is fine to label that way as long as the (5) does not exceed the wave (3) length. It is expected to be relatively short as shown. The analysis continues and concludes below the weekly chart.
Author

Elliott Wave Forecast Team
ElliottWave-Forecast.com


