The financial crash parallel in Treasury yields
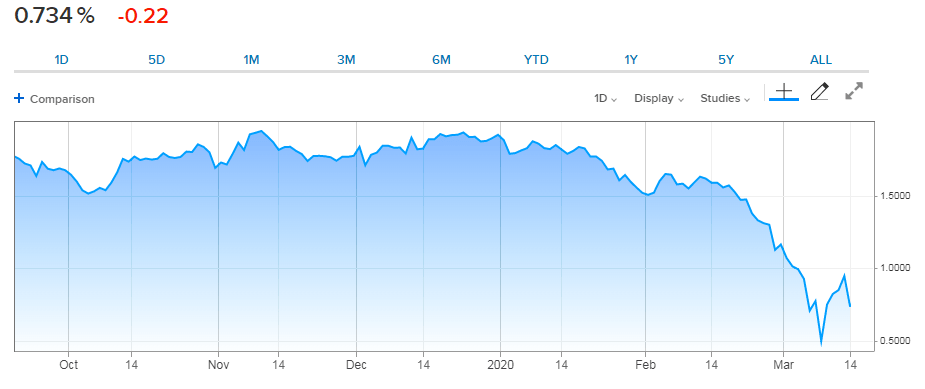
- The 10-year Treasury yield reached a record low close on March 9.
- To Friday March 13 the return had added 45 points.
- Recovery was ended by the Fed's Sunday announcement.

The partial recovery of Treasury market yields in the week to last Friday was short-circuited by the Federal Reserve rate cut and restart of quantitative easing but it has parallels from the early months of the financial crisis a decade ago.
After the FOMC announced its 1% reduction in the fed funds and $700 billion in bond purchases on Sunday a reversal in the direction of Treasury yields was inevitable. To this writing the 10-year Treasury which closed on Friday at 0.946% was returning 0.734%. The 5-year was at 0.494% after closing at 0.702% and the 2-year was at 0.356% following a 0.516% finish on Friday.
10-year Treasury yield
Record low in the 10-year Treasury
On February 12 the yield in the benchmark 10-year closed at 1.63%. The all-time low close came on Monday March 9th at 0.498% and represented a collapse of 1.132% or 113 basis points in three weeks.
By the market finish on that Friday, the 13th, the yield had regained 45 basis points to 0.946%.
The 10-year yield in the financial crisis
The slide in the 10-year yields was comparable to that in November and December 2008. From its close on November 12 at 3.737% the return had dropped to 2.695% by December 3. After brief bounce to 2.745% by December 8 the yield swooned again touching its bottom on December 30 at 2.055% for a total loss of 1.682%.
10-year Treasury yield, 2008-2009
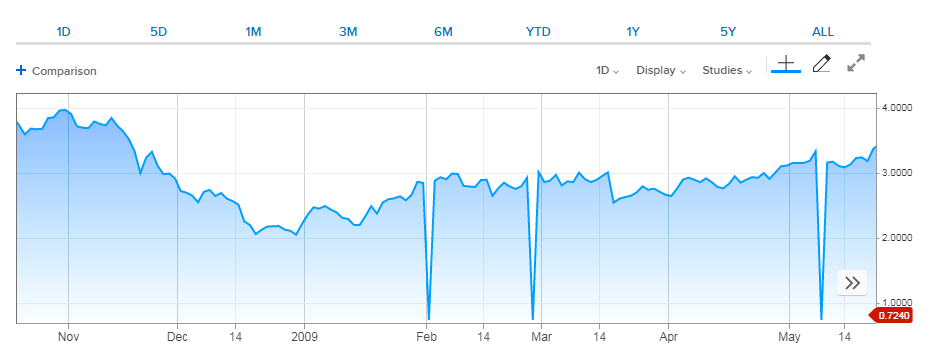
The immediate reaction to this plunge in the midst of the financial crisis, the equities did not reach their nadir until March, was a sharp recovery in yields. By January 7 the 10-year was at 2.496%, a gain of 0.441% or 41 points. The final post-crash high in the yield was not reached until early that June at 3.862%.
That December 2008 low of 2.055% in the 10-year held until September 2011. In the aftermath of the second round of quantitative easing that began in November 2010 and had bought $600 billion in Treasuries by the end of the second quarter of 2011, the 10-year return fell below 2%.
Crisis parallels
The parallels between the financial crash and the current situation are instructive.
In 2008 and 2009 no one knew how long the recession would last, how deep it might be or what permanent damage had been done to the world’s financial system and more importantly investor and business confidence. The Dow dropped about 55% from October 2007 to March 2009 and 37% in the most acute phase from August to November 2008. The Dow is currently off about 28% from its high of February 12.
The extent and severity of the economic damage from this event, like 12 years ago is unknown. But the Treasury yield collapse and recovery hints that the credit market response may be close to running its course.
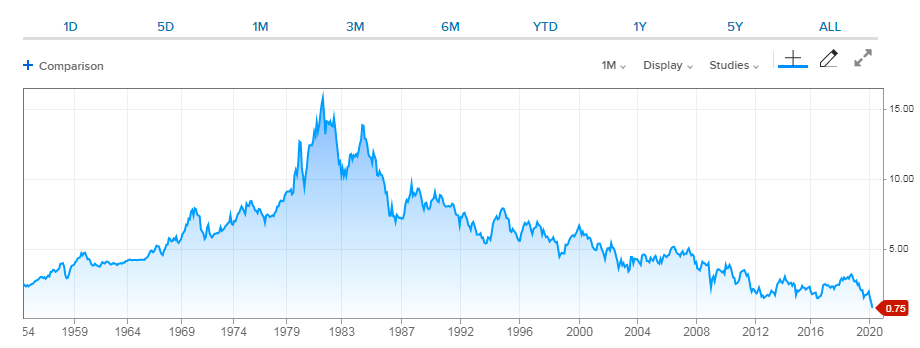
10-year Treasury yield history
Author

Joseph Trevisani
FXStreet
Joseph Trevisani began his thirty-year career in the financial markets at Credit Suisse in New York and Singapore where he worked for 12 years as an interbank currency trader and trading desk manager.

















