The Final Touch?

Market Overview
SPX pushed a little higher last week, breaching the recent high of 9/15 by a tad, and challenging the all-time high of 3028 which is likely to be surpassed before this move is over. This “exuberance” does not come as a surprise, since it was expected. But avid bulls may soon be dismayed as the 40-wk cycle finally takes hold and causes a sharp plunge (perhaps as early as next Wednesday) when the Fed is expected to announce another rate cut. As ArnoutterSchure of Intelligent Investing points out, the great majority of Fed decisions on interest rates since 2016 have been followed by a market correction of varying degrees. So, since the 40-wk cycle low is deemed to be late and still ahead of us, and since this is supported by other cycles topping in early November (Eric HadikInside Track),it’s clear that the odds favor the rally from 2856 coming to an end atabout that time.
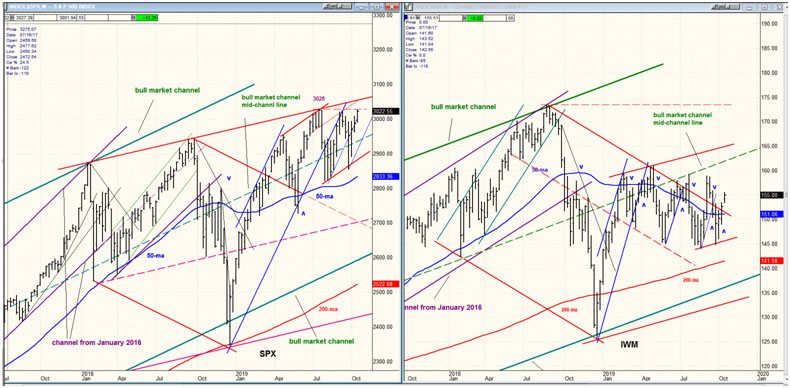
Nor is any of this contradicted by the action of IWM which is still in denial of any immediate strength ahead of us, furthermore visibly increasing its relative weakness to SPX this past week. But since the 40-wk cycle should turn prices up after it bottoms, what lies past November is unclear and we will leave it up to the market to write future history. If EWT technicians are correct, until we see some clear signs that wave 4 has completed, we will not be ready to resume the bullish trend – perhaps not for several more months, and from lower levels.
Market Analysis (All charts are courtesy of QChart)
SPX daily chart
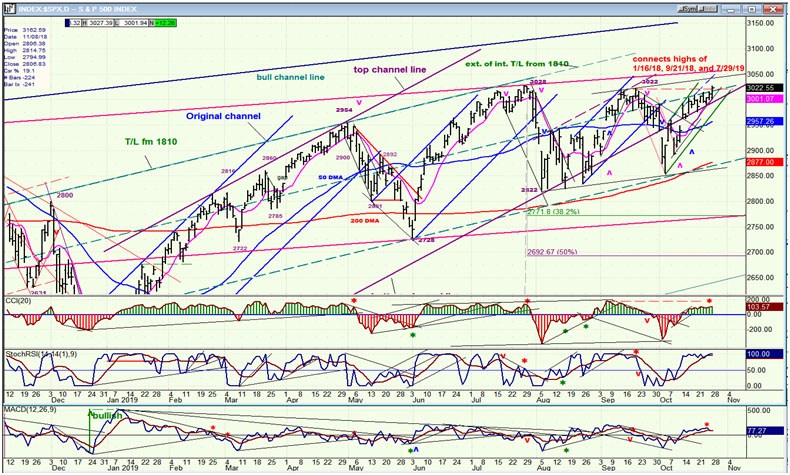
For the past two weeks SPX has used the old channel line -- which had been previously broken and surpassed again -- for support, crawling on it in a display of less than formidable strength. When it drops below it (next Wednesday or Thursday would be ideal) it may just slice through it as well as the bottom line of the small green channel, indicating that the laborious recent uptrend is over and that we have starteda decline into the low of the 40-wk cycle. Of course, if we move decisively above the red trend line instead, I’ll just have to make an about face and continue analyzing the market from a different perspective.
If we do start a sharp retracement from this general area, the best targets could turn out to be either ~ 2770 or ~2690 -- both normal retracements for a correction of the move which started at 2346. Earlier on, I had expected the 40-wk cycle to bring about a more severe correction, but the fact that it has (probably) been delayedinto the end of the most negative seasonal pattern of the year should limit its impact. Even if we do not take into consideration the present cyclical climate, the market action itself suggests that itis the end of a move rather than the beginning or extension of one. As you will note, negative divergence has begun to appear in the daily oscillators.Of course, confirmation will be required…and soon!
SPX hourly chart
The crawling pattern is also very evident on the hourly chart. A sharp rally from 2856 to the top of the previous down channel and a retest of the low, were followed by another sharp continuation of the move which morphed into the current,far less aggressive patternwith traders seemingly marking time until the next FOMC meeting. The formation is very similar to the last three weeks going into the 3028 top (see the daily chart above).
The oscillator pattern calls for one more little wave up creating negative divergence going into the FOMC meeting, which is the best bet fora reversal. Although a decline could be forestalled until the middle of next month. But now we are getting into the nitty-gritty of the last few days of this short-term uptrend, and we’d better leave it to the index to show us how it will do it rather than telling it how it should!
UUP (dollar ETF) daily
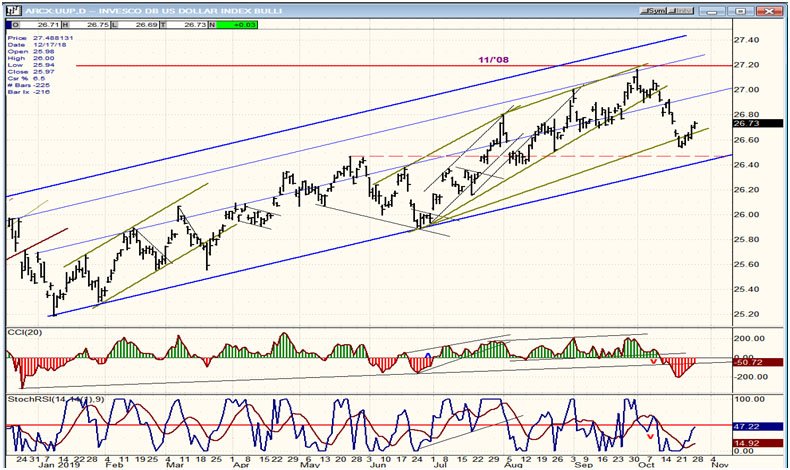
Last week, UUP had a little bounce which lifted the oscillators without issuing a buy signal; so we need to wait until we see what the index does after the Fed meeting. If it moves below the blue channel line, itmay be starting a distribution pattern,since there is still no sign of one on the P&F chart. UUP is a slow mover and it is not likely to make a sharp reversal lower anytime soon.
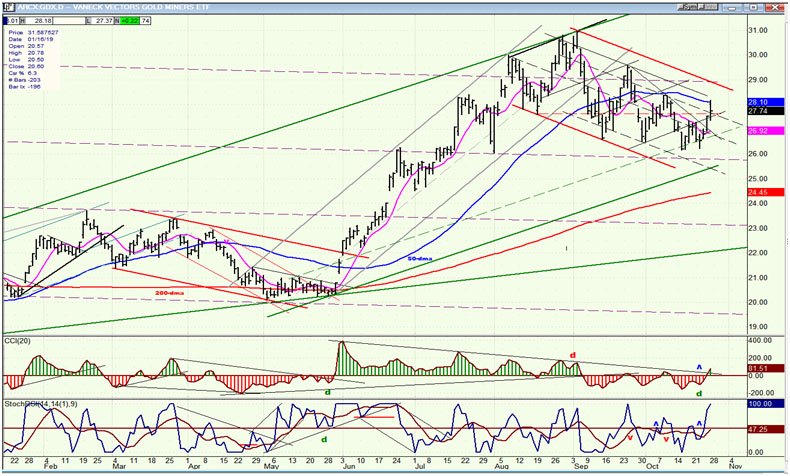
GDX (Gold miners ETF) weekly
GDX may be approaching the end of a well-organized correction pattern which could already have seen its final low. This is what is suggested by the oscillators which appear to be making a break-out move. The uptrend of the past four days found resistance at the blue 50-dma, which could lead to a few days of consolidation followed by a move above the MA. If that occurs, GDX should quickly challenge the top of the red channel.
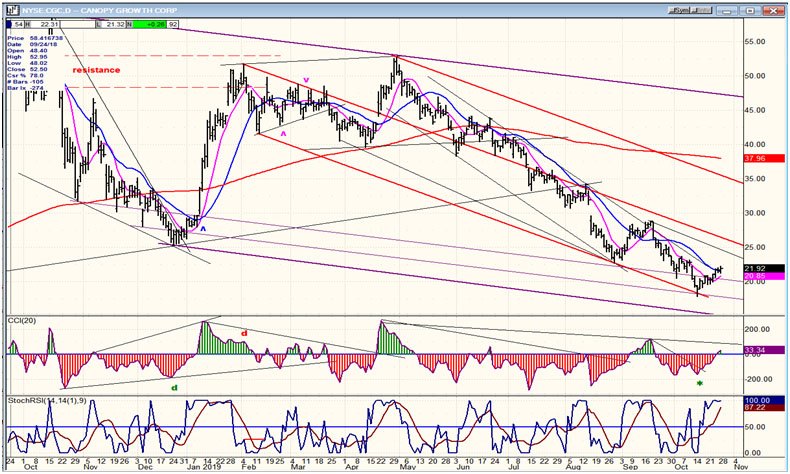
CCG (canopy growth) daily
CGC is in a position to conclude its intermediate downtrend, although it will most likely have to retest its low before it has any chance of moving to the top of the red channel.
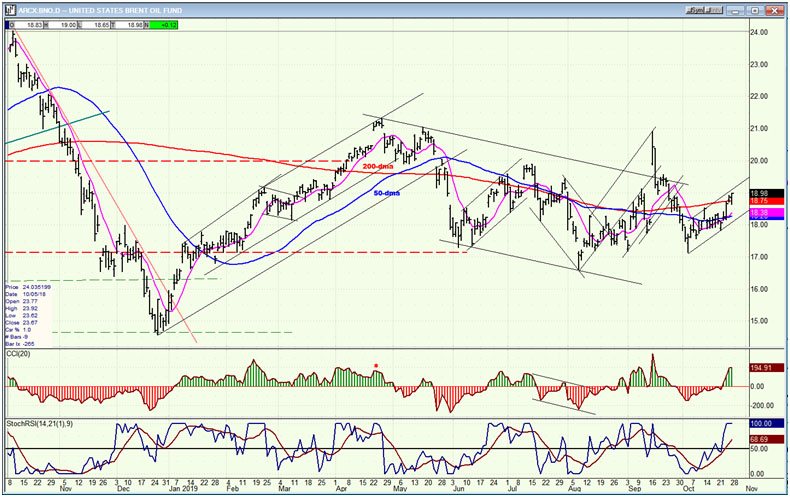
BNO (U.S. Brent oil fund) daily
BNO continues to improve its price action. It has broken out of its corrective channel, quickly retraced, and moved back up to the top trend line. It’s unlikely to extend its current short-term uptrend very far, especially if the market starts to correct, whichwould give BNO an opportunity to retest its low.
Summary
Unless there is a radical departure from the scenario envisaged above, we are heading into the last few days of the uptrend from 2856 with a correction beginning at about the date of the FOMC meeting.
Author

Andre Gratian
Market Turning Points
When I was a stock broker years ago, a friend introduced me to technical analysis of the market and it is not an exaggeration to say that I fell in love with this approach! Ever since then, it has become an increasingly important


