The Fed is hiking at the most aggressive pace ever, and what it means for housing

There has never been a faster start to Fed rate hikes than now. Let's discuss the impact on housing and the economy in general.
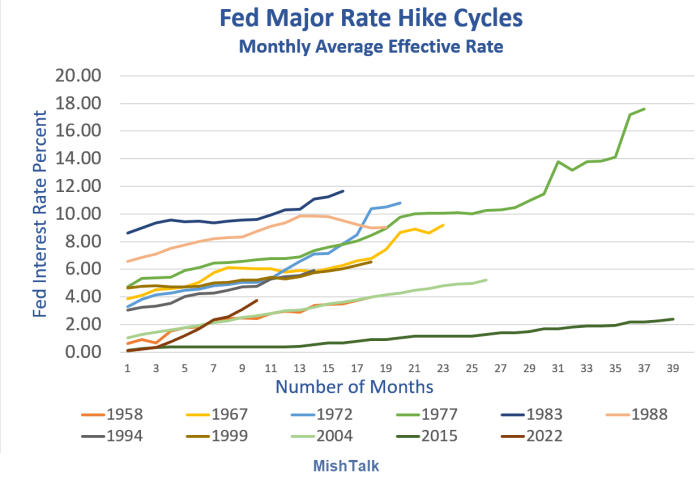
Monthly average Fed Funds Rate via St. Louis Fed
Chart notes
- I use monthly averages because the Fed now targets a range. Also the Fed Funds Target Rate is discontinued and only dates to 1982.
- This is the steepest, most aggressive hiking cycle ever.
You can see the impact especially in mortgage rates and thus housing.
30-year fixed mortgage rates 1975-present
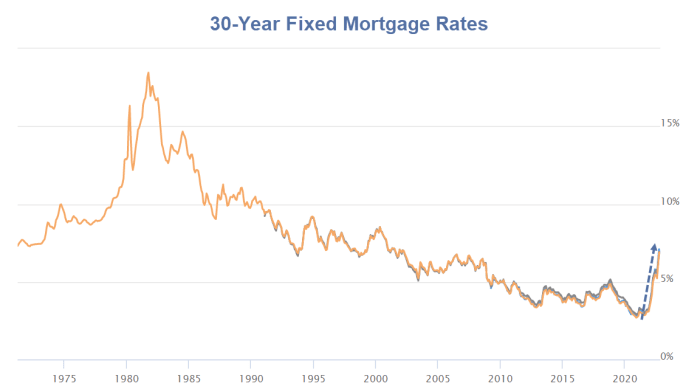
30-year fixed mortgage rates courtesy of Mortgage News Daily
30-year fixed mortgage rates - One year
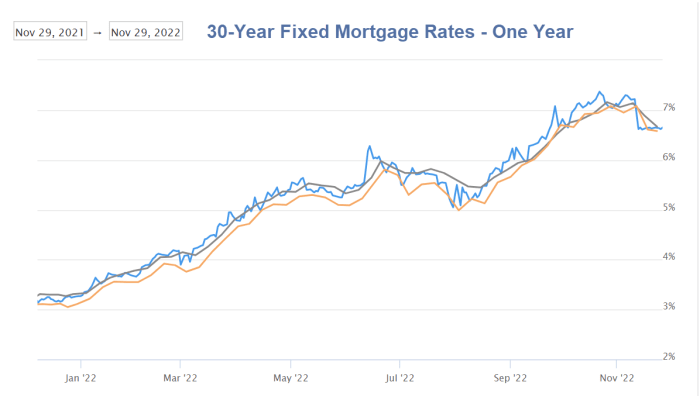
30-year fixed mortgage rates courtesy of Mortgage News Daily
Existing home sales decline 9th month, down another 5.9 percent
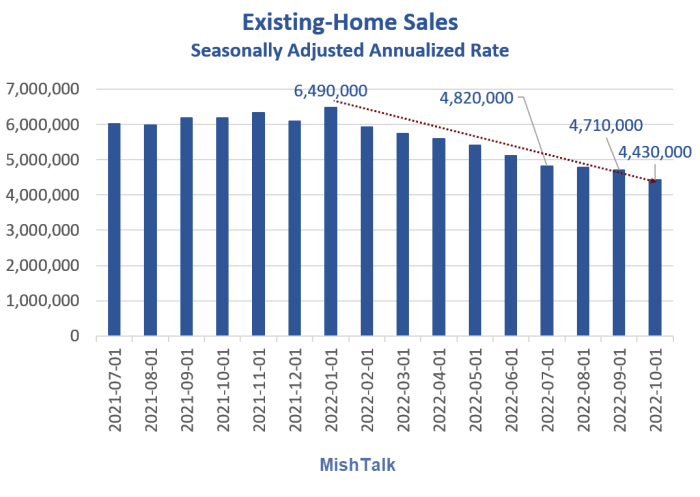
Existing home sales from the National Association of Realtors via St. Louis Fed
With the Fed rate hikes, Existing Home Sales Decline 9th Month, Down Another 5.9 Percent
Existing home sales crash
- Existing home sales are down 28.4% from one year ago.
- Existing home sales are down 31.7% since January.
That's a crash. And never have we seen such declines other than in recessions.
The crash is in transactions, not price.
Cost of owning
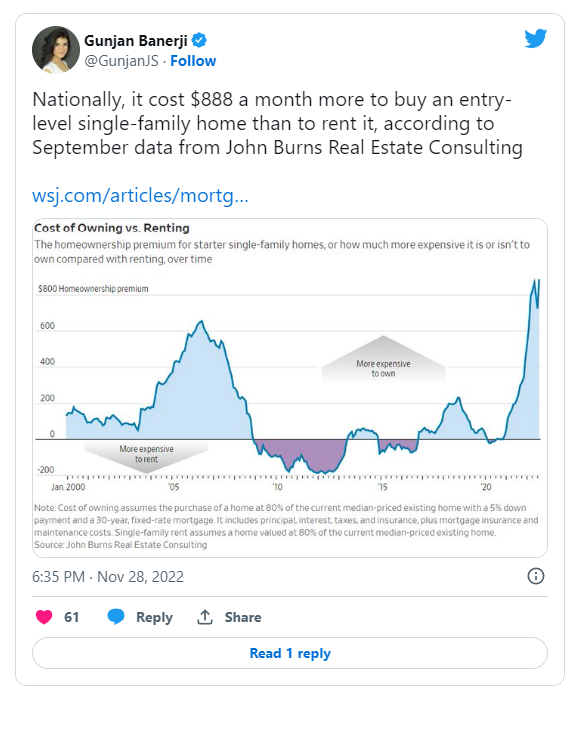
"Nationally, it cost $888 a month more to buy an entry-level single-family home than to rent it, according to September data from John Burns Real Estate Consulting. A 30-year-fixed mortgage with 5% down (including principal, interest, taxes, insurance and maintenance) on such a home cost $3,058 a month, while the median monthly rent on such a single-family house was $2,170, based on John Burns research."
The cost of owning a home with a mortgage is the most expensive since at least 2000.
The current housing cycle landscape
1-3 year housing outlook
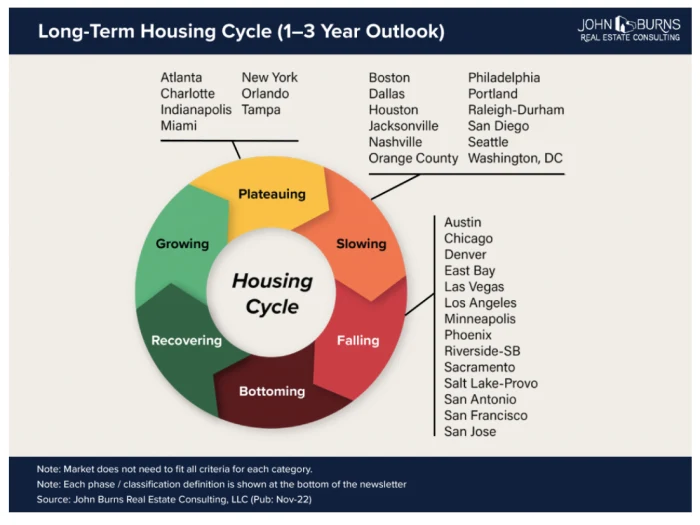
Image courtesy of John Burns Real Estate Consulting
Falling Real Estate markets
Several major markets have now reached the falling phase of the cycle, characterized by flat or declining prices, limited capital investment, and shrinking housing demand.
- Despite being among the largest resale markets in the country, new home construction in Chicago and Minneapolis, whose recoveries lagged in the post-GFC expansion, struggled to take off during the pandemic-fueled housing boom. These economies continue to underperform, and we worry about significant out-migration and sustained population loss.
- Austin, Sacramento, and Salt Lake City, all standouts for in-migration and robust, tech employment demand / job growth throughout the pandemic, have reversed course quickly.
- Phoenix and Riverside-SB have also reversed course quickly, in part due to significant speculative investment that drove prices up quickly. They also benefitted tremendously from the industrial building development boom that has now cooled.
- Sales are dropping and resale supply is skyrocketing, driving home price appreciation down fast, with home values now falling month over month. Single-family construction activity has pulled back, as many builders in these markets are reluctant to open new communities during a downturn.
Housing is local (until it isn't)
Slowing markets include Dallas, Jacksonville, and Raleigh-Durham.
The rest are plateauing. There is no major market bottoming, recovering, or growing.
It may be true at the micro level, but I'm tired of the expression "Housing is Local" when nearly the entire country is headed the same way.
Not a crash?!
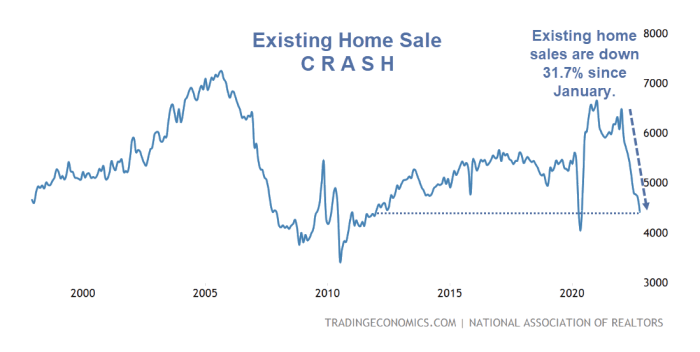
Existing Home Sales long-term chart courtesy of Trading Economics
New Home Sales
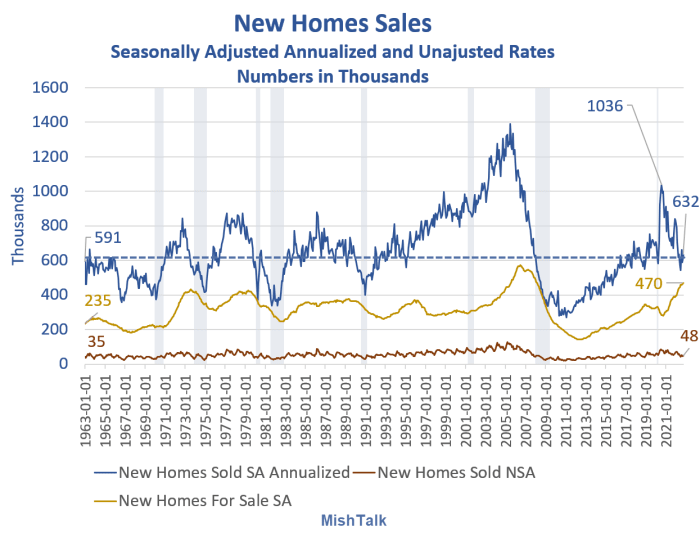
New Home Sales data from the Census Department, chart by Mish
Last month I noted huge new sales negative revisions for the August. This month the Census Department reports negative revisions for September.
If the pattern holds, there will be negative revisions next month too.
What about cancellations?
The Census Department does not subtract cancellations from its reports and cancellations due to rising mortgage rates have been huge.
In declining sales environments and economic downturns (now), the Census Department dramatically overstates sales, even if we ignore revisions.
In economic upturns, the Census Department understates sales.
For discussion, please see New Home Sales Bounce 7.5 Percent From Negative Revisions
Factoring in cancellations, new home sales are about 468,000 SAAR about where they were in 1963.
But hey, let's not call that a crash either.
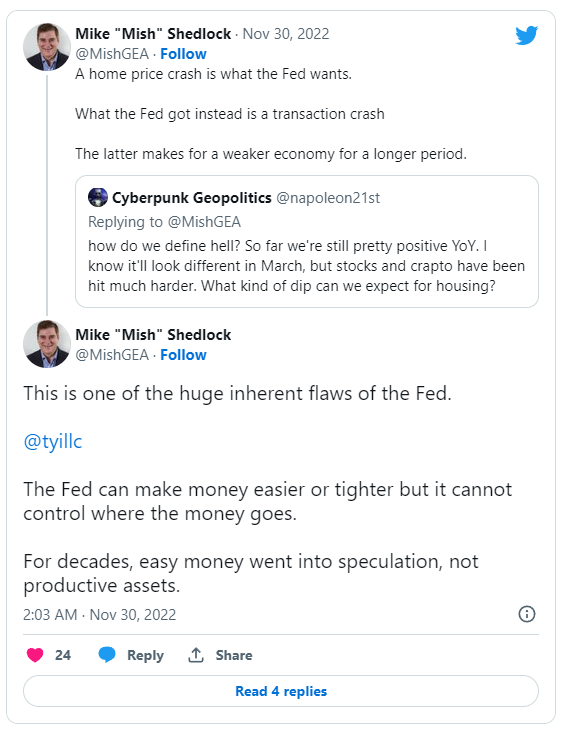
Housing hell
Looking ahead
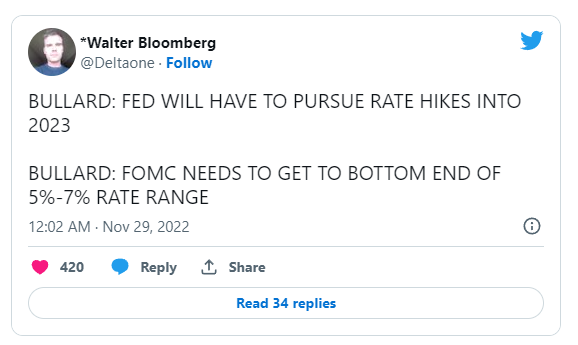
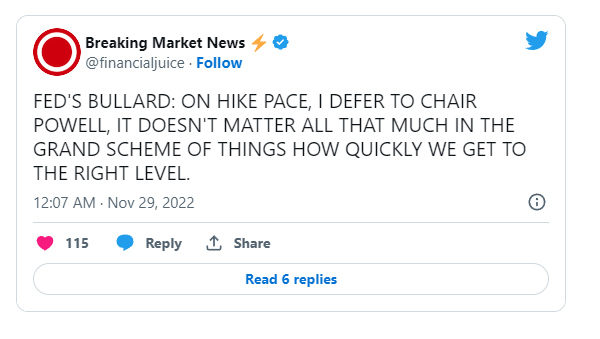
The range of hikes is allegedly 5-7 percent.
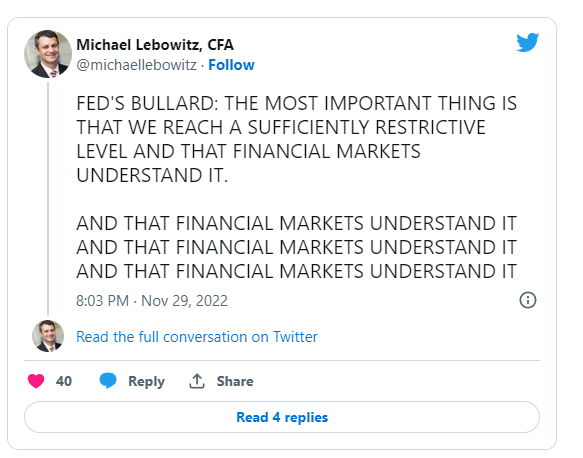
Who cares how we get there
Rate hike odds for December 2022
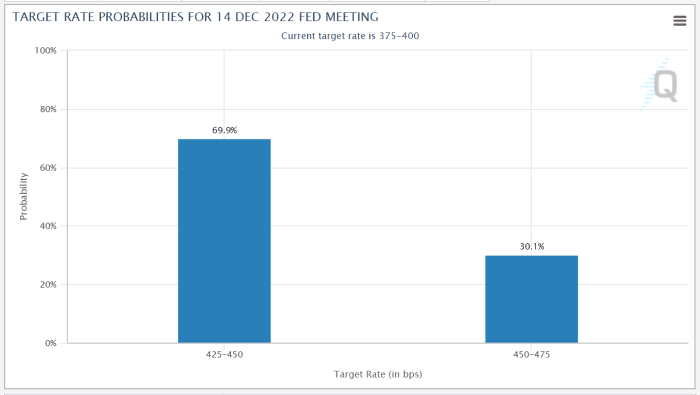
Chart of rate hike odds from CME FedWatch
Expect another half-point hike on December 14.
Rate hike odds for December 2023
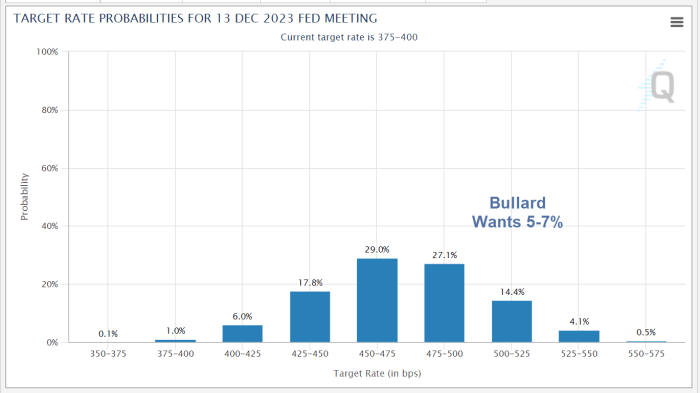
Chart of rate hike odds from CME FedWatch
Impeccable track record
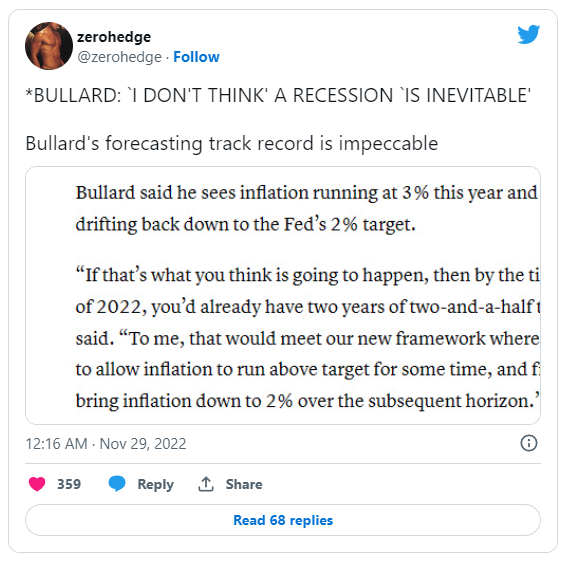
The market does not think we get to 5.0% next year and neither do I.
Bullard has an impeccable track record of being wrong.
Meanwhile, housing is going to hell. Don't expect that to change for 1-3 years according to John Burns.
If housing is weak for three years, expect the economy to be weak for three years as well.
Nonetheless, my forecast for unemployment is not as dire as most. For discussion, please see Expect a Long Period of Weak Growth, Whether or Not It's Labeled Recession.
Author

Mike “Mish” Shedlock's
Sitka Pacific Capital Management,Llc


