The ETH/USD outlook: another downfall is expected

Over the weekend the price of Ethereum has increased by 15.13% at first coming up from $146 at its lowest point on Friday to $168.58 at its highest point on Sunday and showing a strong bullish momentum.
From there the price of Ethereum started falling down fast as it decreased by 20.22% coming to $138.44 on FXOpen UK at its lowest point yesterday.
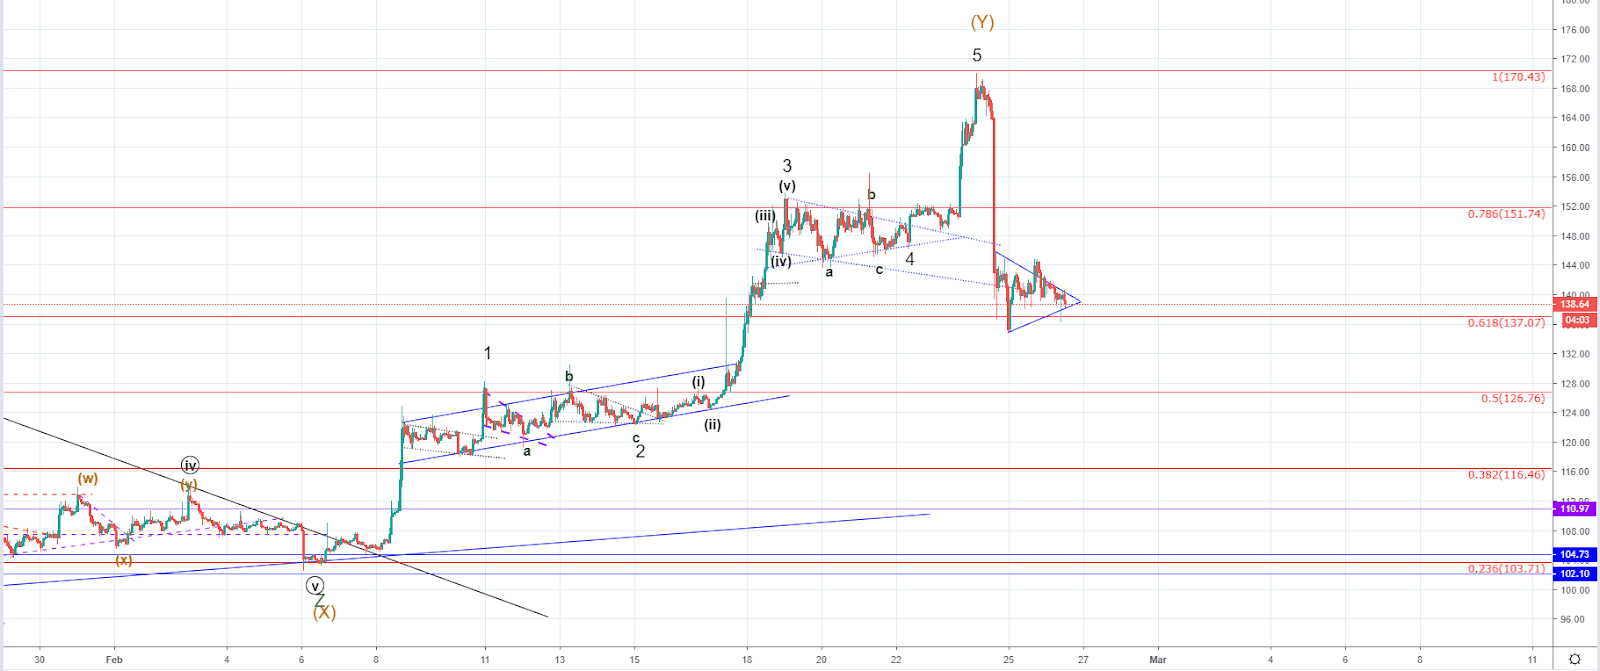
Looking at the hourly chart, you can see that the price found support around 0.618 Fibonacci level on yesterday’s downfall and the price action started forming a symmetrical triangle around those levels.
Considering the context, this triangle could be interpreted as a bearish pennant which is known to be a trend continuation pattern so another downfall from here could be expected.
As the Intermediate Y wave out of the WXY correction ended as I have counted 5 waves, we are most likely seeing the start of a trend continuation to the downside.
If this is true, then we could see the price increase from here to the vicinity of the previous 5th wave’s ending point, which would be the second wave out of the presumed impulsive decrease that started yesterday, similarly to what can be currently seen on the chart of Ripple.
More consolidation and sideways movement would now be expected before another downfall as the market participants are getting confused by these current market conditions.
Author

FXOpen Broker Team
FXOpen


