The day after [Video]
![The day after [Video]](https://editorial.fxstreet.com/images/Markets/Commodities/Metals/Gold/stacks-of-gold-bars-19033163_XtraLarge.jpg)
US Dollar: Dec '22 USD is Up at 110.815.
Energies: Oct '22 Crude is Up at 83.43.
Financials: The Dec '22 30 Year bond is Up 2 ticks and trading at 130.22.
Indices: The Dec '22 S&P 500 Emini ES contract is 9 ticks Lower and trading at 3804.00.
Gold: The Dec'22 Gold contract is trading Up at 1677.70. Gold is 20 ticks Higher than its close.
Initial conclusion
This is not a correlated market. The dollar is Up, and Crude is Up which is not normal, and the 30-year Bond is trading Higher. The Financials should always correlate with the US dollar such that if the dollar is lower, then the bonds should follow and vice-versa. The S&P is Lower, and Crude is trading Higher which is correlated. Gold is trading Higher which is not correlated with the US dollar trading Up. I tend to believe that Gold has an inverse relationship with the US Dollar as when the US Dollar is down, Gold tends to rise in value and vice-versa. Think of it as a seesaw, when one is up the other should be down. I point this out to you to make you aware that when we don't have a correlated market, it means something is wrong. As traders you need to be aware of this and proceed with your eyes wide open. Currently all of Asia is trading Lower with the exception of Singapore which is fractionally Higher at this time. Conversely all of Europe is trading Lower.
Possible challenges to traders today
-
Unemployment Claims are out at 8:30 AM EST. This is Major.
-
Current Account is out at 8:30 AM EST. This is Major.
-
CB Leading Index is out at 10 AM EST. This is Major.
-
Natural Gas Storage is out at 10:30 AM EST. This is Major.
Treasuries
Traders, please note that we've changed the Bond instrument from the 30 year (ZB) to the 10 year (ZN). They work exactly the same.
We've elected to switch gears a bit and show correlation between the 10-year bond (ZN) and the S&P futures contract. The S&P contract is the Standard and Poor's, and the purpose is to show reverse correlation between the two instruments. Remember it's likened to a seesaw, when up goes up the other should go down and vice versa.
Yesterday the ZN made its move at around 8:15 AM EST. The ZN hit a High at around that time and the S&P moved Higher at around the same time. If you look at the charts below ZN gave a signal at around 8:15 AM and the S&P moved Higher at around the same time. Look at the charts below and you'll see a pattern for both assets. ZN hit a High at around 8:15 AM and the S&P was moving Higher shortly thereafter. These charts represent the newest version of MultiCharts and I've changed the timeframe to a 15-minute chart to display better. This represented a Shorting opportunity on the 10-year note, as a trader you could have netted about a dozen ticks per contract on this trade. Each tick is worth $15.625. Please note: the front month for the ZN is now Dec '22. The S&P contract is also Dec' 22. I've changed the format to Renko Bars such that it may be more apparent and visible.
Charts courtesy of MultiCharts built on an AMP platform
ZN - Dec 2022 - 09/21/22
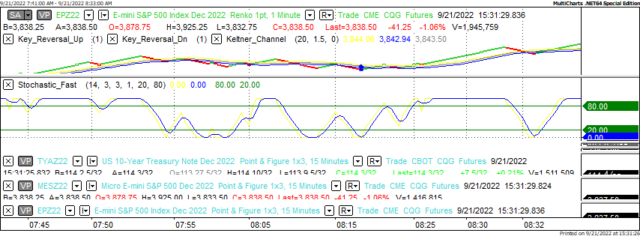
S&P - Dec 2022 - 9/21/22
Bias
Yesterday we gave the indices a Neutral bias as it was FOMC Day, and we always maintain a Neutral bias on that day. The markets didn't like the Fed rate hike and the Dow closed down 522 points; the other indices lost ground as well. Today we aren't dealing with a correlated market and our bias is Neutral.
Could this change? Of Course. Remember anything can happen in a volatile market.
Commentary
Well, the Fed came and has spoken. The Federal Reserve has elected to raise rates by three quarters of a full point bringing the FFR or Overnight Rate to 3.25%, a level not seen since the 1990's. They are resolved to curb inflation down to a 2% annual rate. The concern is if they will slow down spending to the point of creating an economic downturn. Now some might say how can that happen. Let me take the time to explain. The strategy behind the Federal Reserve hiking rates is to curb spending and by doing so bring down prices. Businesses and companies do not just arbitrarily lower prices, they lower prices when spending and demand is down. Whenever you see a sale at a retailer (whether online or otherwise) it's never the hot selling items that are on sale, it's the items that aren't moving well that go on sale. The same analogy applies to inflation. The Fed is trying to slow down consumer spending to the point where retailers will lower prices. How do they do that? Raise interest rates and make it tougher to borrow or use credit. The problem with this is the Fed has to be very careful not to slow down consumer spending to the point of creating an economic downturn. If that happens consumer spending will fall and so will the need for workers which means layoffs and we all know what happens after that. Can they do this successfully? Odds are they can, but they cannot be asleep at the wheel. They were asleep last year when they told everyone that the increase in prices was temporary and we're all dealing with it now.
Author

Nick Mastrandrea
Market Tea Leaves


