The day after – Fed keeps interest rates unchanged [Video]
![The day after – Fed keeps interest rates unchanged [Video]](https://editorial.fxstreet.com/images/Markets/Commodities/Metals/Gold/gold-nuggets-14424039_XtraLarge.jpg)
US Dollar: Sept USD Up at 93.245.
Energies: Oct'20 Crude is Down at 40.28.
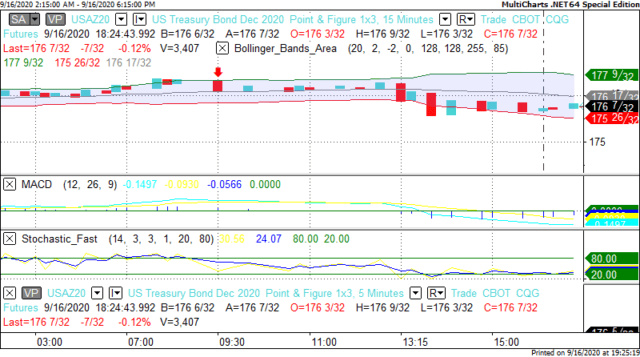
Financials: The Dec '20 30 year bond is Up 6 ticks and trading at 176.13.
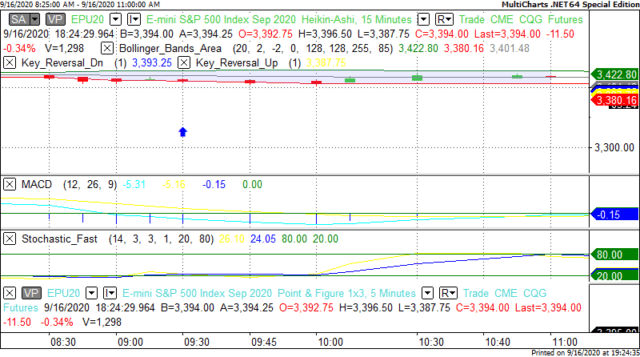
Indices: The Sept S&P 500 emini ES contract is 156 ticks Lower and trading at 3340.50.
Gold: The Dec'20 Gold contract is trading Down at 1950.70 Gold is 195 ticks Lower than its close.
Initial Conclusion
This is not a correlated market. The dollar is Up+ and Crude is Down- which is normal and the 30 year Bond is trading Higher. The Financials should always correlate with the US dollar such that if the dollar is lower then bonds should follow and vice-versa. The S&P is Lower and Crude is trading Lower which is not correlated. Gold is trading Lower which is correlated with the US dollar trading Up. I tend to believe that Gold has an inverse relationship with the US Dollar as when the US Dollar is down, Gold tends to rise in value and vice-versa. Think of it as a seesaw, when one is up the other should be down. I point this out to you to make you aware that when we don't have a correlated market, it means something is wrong. As traders you need to be aware of this and proceed with your eyes wide open.
All of Asia is trading Lower at this time. Currently all of Europe is trading Lower as well.
Possible Challenges To Traders Today:
-
Philly Fed MFG Index is out at 8:30 AM EST. This is Major.
-
Unemployment Claims are out at 8:30 AM EST. This is Major.
-
Building Permits are out at 8:30 AM EST. This is Major.
-
Housing Starts are out at 8:30 AM EST. This is Major.
-
Natural Gas Storage is out at 10:30 AM EST. This is Major.
Treasuries
We've elected to switch gears a bit and show correlation between the 30 year bond (ZB) and The S&P futures contract. The S&P contract is the Standard and Poor's and the purpose is to show reverse correlation between the two instruments. Remember it's liken to a seesaw, when up goes up the other should go down and vice versa.
Yesterday the ZB made it's move at around 9:30 AM EST. The ZB hit a High at around that time and the S&P moved Higher. If you look at the charts below ZB gave a signal at around 9:30 AM EST and the S&P moved Higher at around the same time. Look at the charts below and you'll see a pattern for both assets. ZB hit a High at around 9:30 AM EST and the S&P was moving Higher shortly thereafter. These charts represent the newest version of MultiCharts and I've changed the timeframe to a 15 minute chart to display better. This represented a Shorting opportunity on the 30 year bond, as a trader you could have netted about 30 ticks per contract on this trade. Each tick is worth $31.25. Please note: the front month for the ZB is now Dec '20. The S&P contract remains at Sept '20. I've changed the format to Renko bars such that it may be more apparent and visible.
Charts Courtesy of MultiCharts built on an AMP platform
Bias
Yesterday we gave the markets a Neutral bias as it was FOMC Day and we always maintain a Neutral bias on that day. The Dow closed 37 points Higher however the S&P and Nasdaq closed Lower. Today we aren't dealing with a correlated market and our bias is to the Downside.
Could this change? Of Course. Remember anything can happen in a volatile market.
Commentary
Well just as we suspected, the Federal Reserve didn't raise interest rates and instead suggested that rates would be at the current level for an extended period of time; going to the end of 2023. Additionally it was suggested that the Federal Reserve is apt to develop a set of criteria that would solidify the need to hike interest rates. This is highly unusual as the Fed is more willing to use criteria to answer why to lower. But as in all things only time will tell how this works...
Author

Nick Mastrandrea
Market Tea Leaves


