The Day After [Video]
![The Day After [Video]](https://editorial.fxstreet.com/images/Markets/Commodities/Metals/Gold/gold-on-weight-scale-gm165418687-21879510_XtraLarge.jpg)
US Dollar: Dec USD is Up at 97.155.
Energies: Jan'20 Crude is Up at 59.03.
Financials: The Mar'20 30 year bond is Down 14 ticks and trading at 158.15.
Indices: The Dec S&P 500 emini ES contract is 23 ticks Higher and trading at 3148.75.
Gold: The Feb'20 Gold contract is trading Up at 1477.50. Gold is 25 ticks Higher than its close.
Initial Conclusion
This is not a correlated market. The dollar is Up+ and Crude is Up+ which is not normal and the 30 year Bond is trading Lower. The Financials should always correlate with the US dollar such that if the dollar is lower then bonds should follow and vice-versa. The S&P is Higher and Crude is trading Higher which is not correlated. Gold is trading Higher which is not correlated with the US dollar trading Up. I tend to believe that Gold has an inverse relationship with the US Dollar as when the US Dollar is down, Gold tends to rise in value and vice-versa. Think of it as a seesaw, when one is up the other should be down. I point this out to you to make you aware that when we don't have a correlated market, it means something is wrong. As traders you need to be aware of this and proceed with your eyes wide open.
At this time Asia is trading mainly Higher with the exception of the Shanghai exchange which is Lower at this time. Currently all of Europe is trading Higher.
Possible Challenges To Traders Today:
-
PPI is out at 8:30 AM EST. This is Major.
-
Core PPI is out at 8:30 AM EST. This is Major.
-
Unemployment Claims is out at 8:30 AM EST. This is Major.
-
Natural Gas Storage is out at 10:30 AM EST. This is Major.
-
30-y Bond Auction starts at 1 PM EST. This is Major.
Treasuries
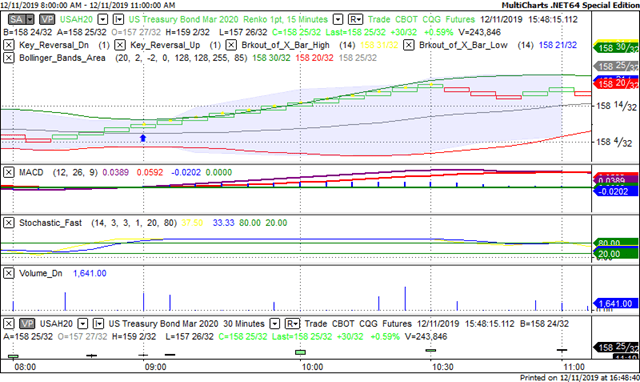
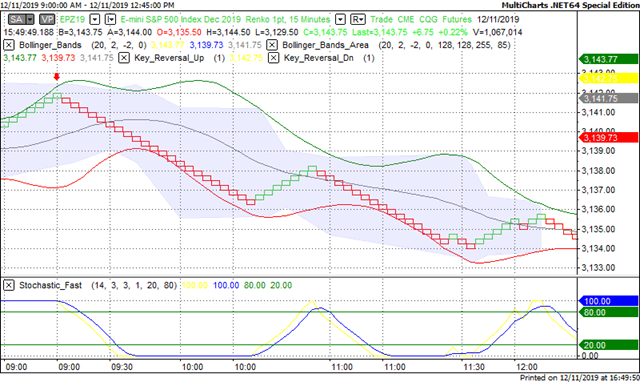
We've elected to switch gears a bit and show correlation between the 30 year bond (ZB) and The S&P futures contract. The S&P contract is the Standard and Poor's and the purpose is to show reverse correlation between the two instruments. Remember it's liken to a seesaw, when up goes up the other should go down and vice versa.
Yesterday the ZB made a major move at around 9 AM EST. The ZB hit a High at around that time and the S&P moved Higher. If you look at the charts below ZB gave a signal at around 9 AM EST and the S&P moved Higher at the same time. Look at the charts below and you'll see a pattern for both assets. ZB hit a High at around 9 AM and the S&P was moving Higher shortly thereafter. These charts represent the newest version of MultiCharts and I've changed the timeframe to a 15 minute chart to display better. This represented a Long opportunity on the 30 year bond, as a trader you could have netted about a dozen ticks per contract on this trade. Each tick is worth $31.25. Please note: the front month for the ZB is now March '20. The S&P contract is still December. I've changed the format to Renko bars such that it may be more apparent and visible.
Charts Courtesy of MultiCharts built on an AMP platform
Bias
Yesterday we gave the markets a Neutral bias as it was FOMC Day and we always maintain a Neutral bias on that day. The Dow gained 30 points and the other indices gained ground as well. Today we aren't dealing with a correlated market and our bias is Neutral.
Could this change? Of Course. Remember anything can happen in a volatile market.
Commentary
We were in for a bit of a surprise yesterday as the Fed decided not to raise rates or cut them but rather left them as they are. Additionally the Fed claims to make no adjustments in 2020 and has only one rate hike slated for 2021. The problem that I see with all this is as follows:
- The Federal Reserve has no idea what the economy is going to look like in 2021. We may in fact have a new administration in office by that time and everything can change.
- The Federal Reserve has decided not to lower rates at a time of the year where it really counts that being the holiday shopping season. This is the time of year where consumer spending really kicks in and having a rate cut really helps.
The Fed has decided to placate the markets by offering a "stand pat" stance on interest rates but all of this is for naught as only time will tell what events may unfold and what actions need be taken.
Author

Nick Mastrandrea
Market Tea Leaves


